Background
In the busy world of contemporary life managing finances is a difficult and stressful activity often due to the lack of economic knowledge and financial management.
My Role
I was involved throughout the whole UX process with help from two other designers. They helped in gathering data / information during the research phase and unpacking the problem. I then finished off the project from the strategy phase till pixel perfect UI design screens.
Research
Overview:
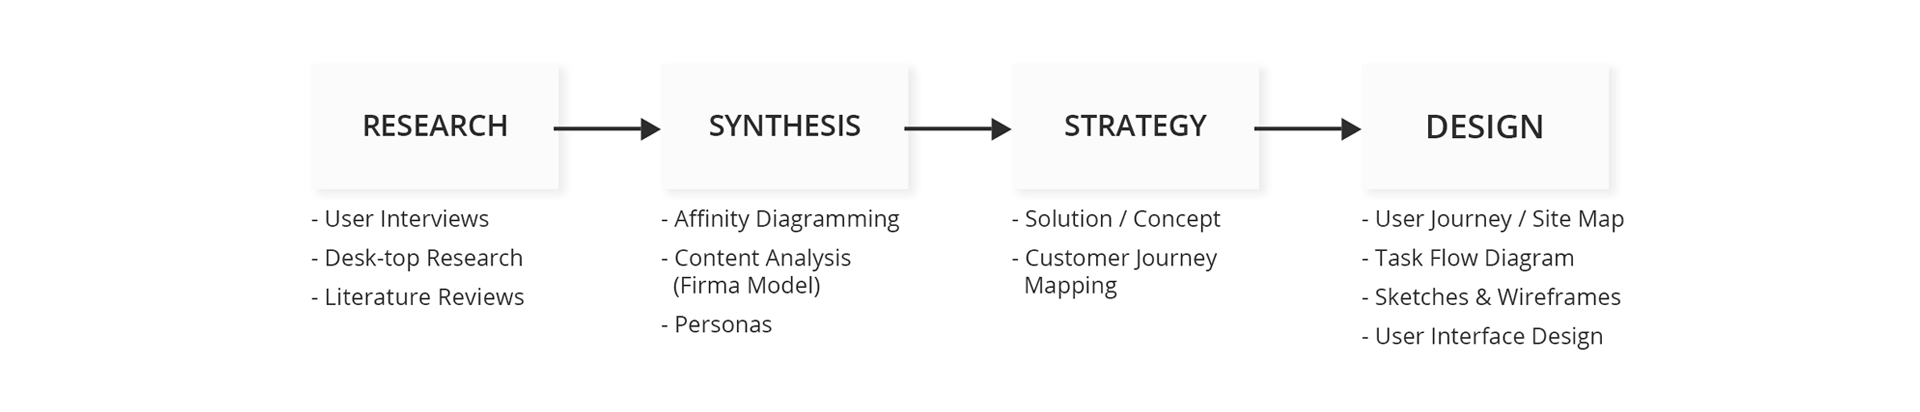
We chose to explore and focus on south African household expenditure in the Gauteng region. We used methods such as structured user interviews, intense desktop research and literature review to obtain our information. When doing user interviews, we wanted to get 20 people who reside in Gauteng. One group of 10 people happened to be financially literate and helped us in coming up with a relevant product or solution for them. The other 10 people happened to not have any financial literacy. This helped us in creating a solution to assist them understand how to manage their finances better. Age was not relevant as we just wanted any person who has a responsibility of paying some form of household expenses.
We then categorised our information by means of an affinity diagram to compare similarities, differences and to achieve insights or pain points. We thereafter plotted our data on a firma model (Framework) and made conscious connections between different effects of the problem.
Insights:
Through our conducted research we have noticed that household expenses are more of a need rather than a want. The household expenses that have been recognised as the most important and expensive are; food, utility bills and rent. These expensive needs have led to inability to save funds at the end of every month.
According to our desktop research, household savings also play a huge role in the economy. The challenge is that people do not understand basic knowledge of the economy and how their savings allow for economic growth, which thereafter means higher wages, salaries and more savings.
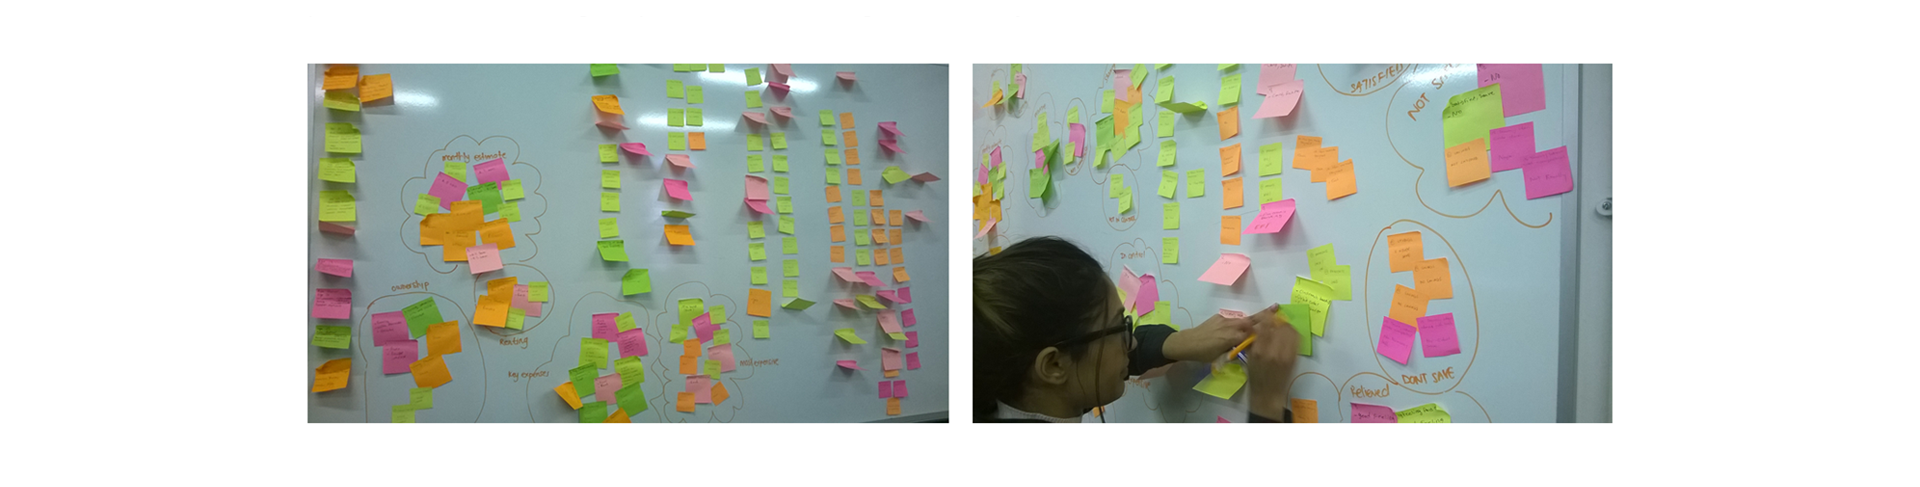
Affinity Diagramming
Synthesis
We used Affinity diagramming to compare similarities, and differences from our data. Also to achieve deeper insights and identifying where pain points exists. Therefore the design implication of each insight can be fully considered on its own when we get to designing phase.
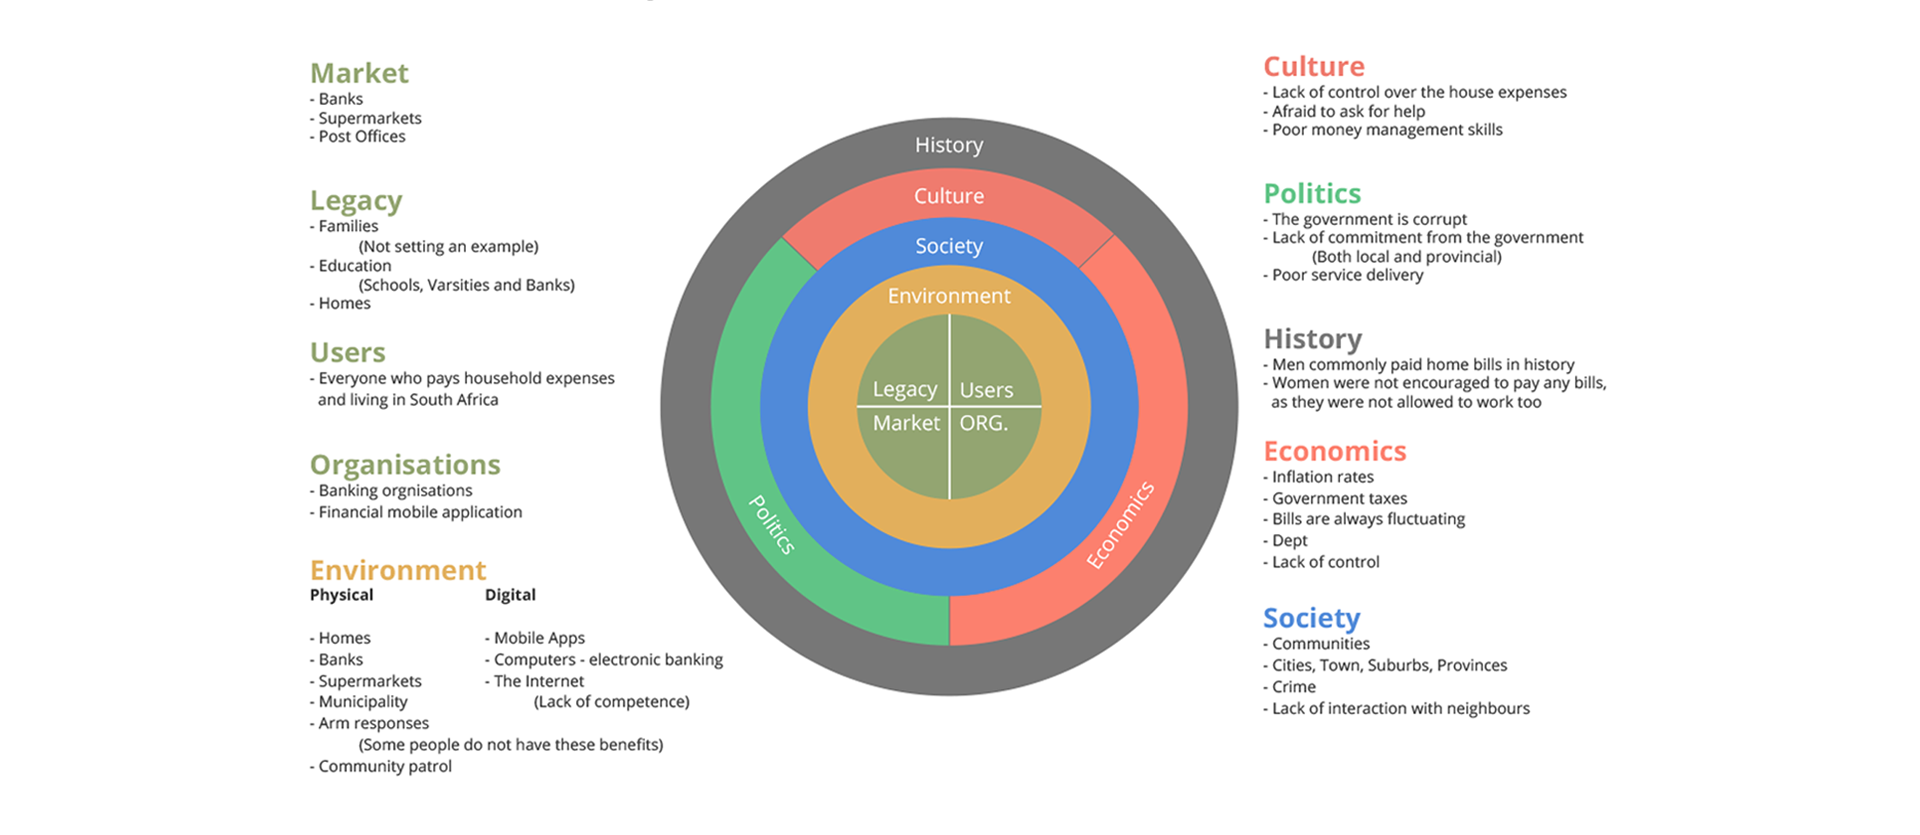
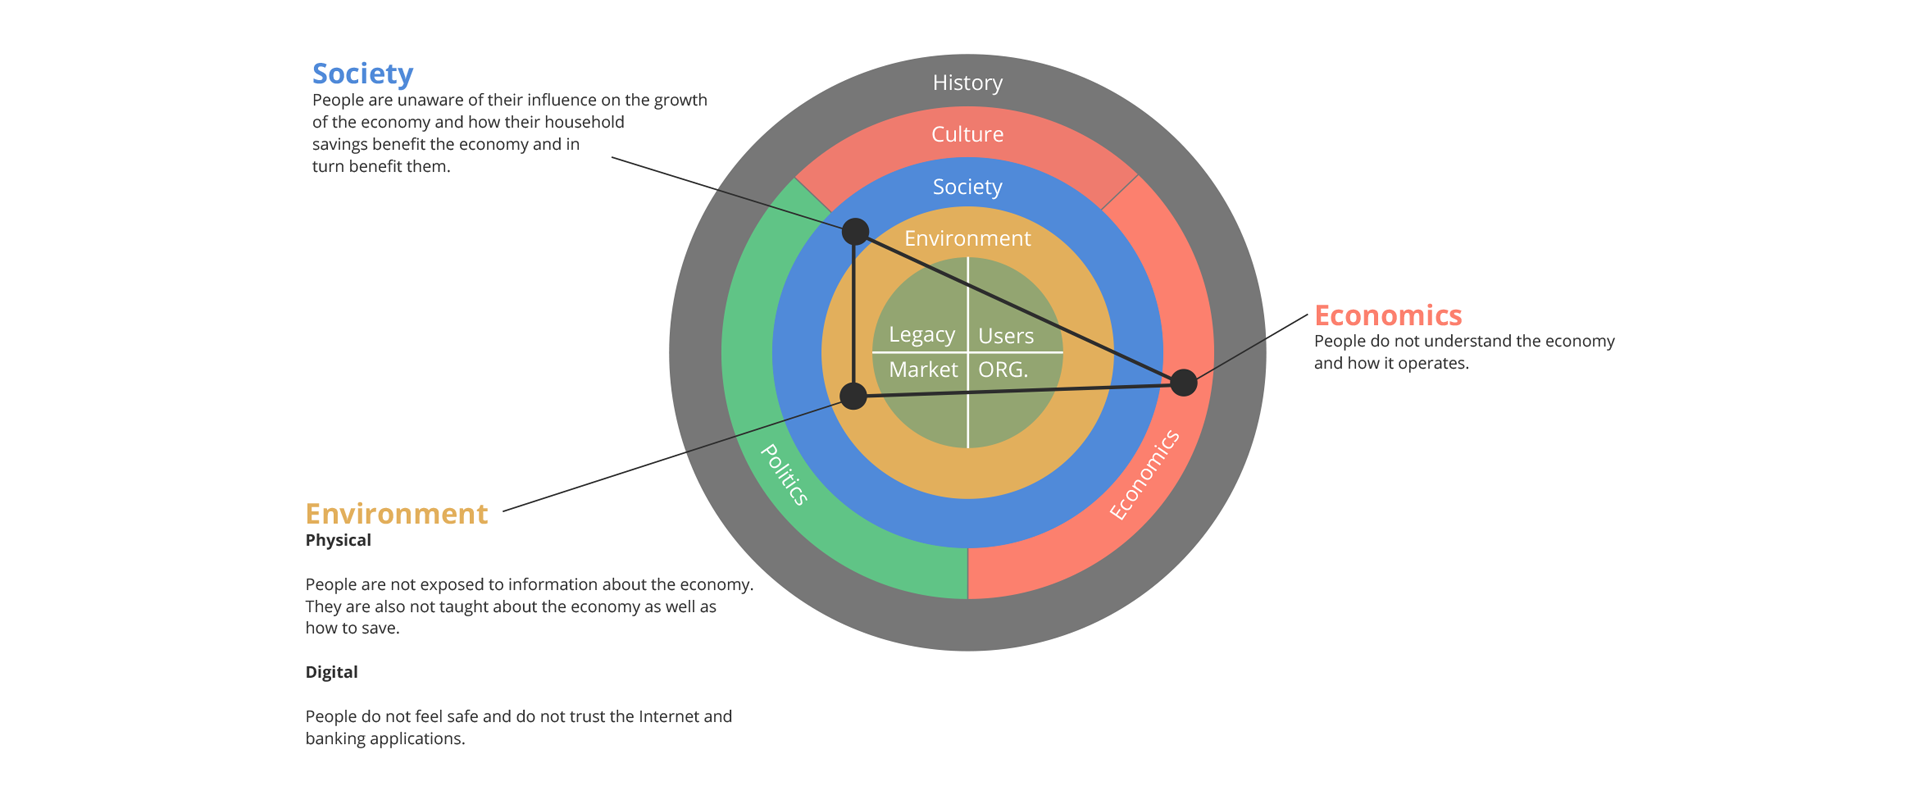
Firma Model
Synthesis – Content Analysis
Firma Model is a design framework that helps ensure the research framing is comprehensive but not too unwieldy. It provides designers, researchers with the basic elements that (the areas of concern) ultimately constitute to a big picture.
We used the Firma Model to plot our data and made conscious connections between different effects of the problem we trying to solve and came out with a clear design area(s) of concern.
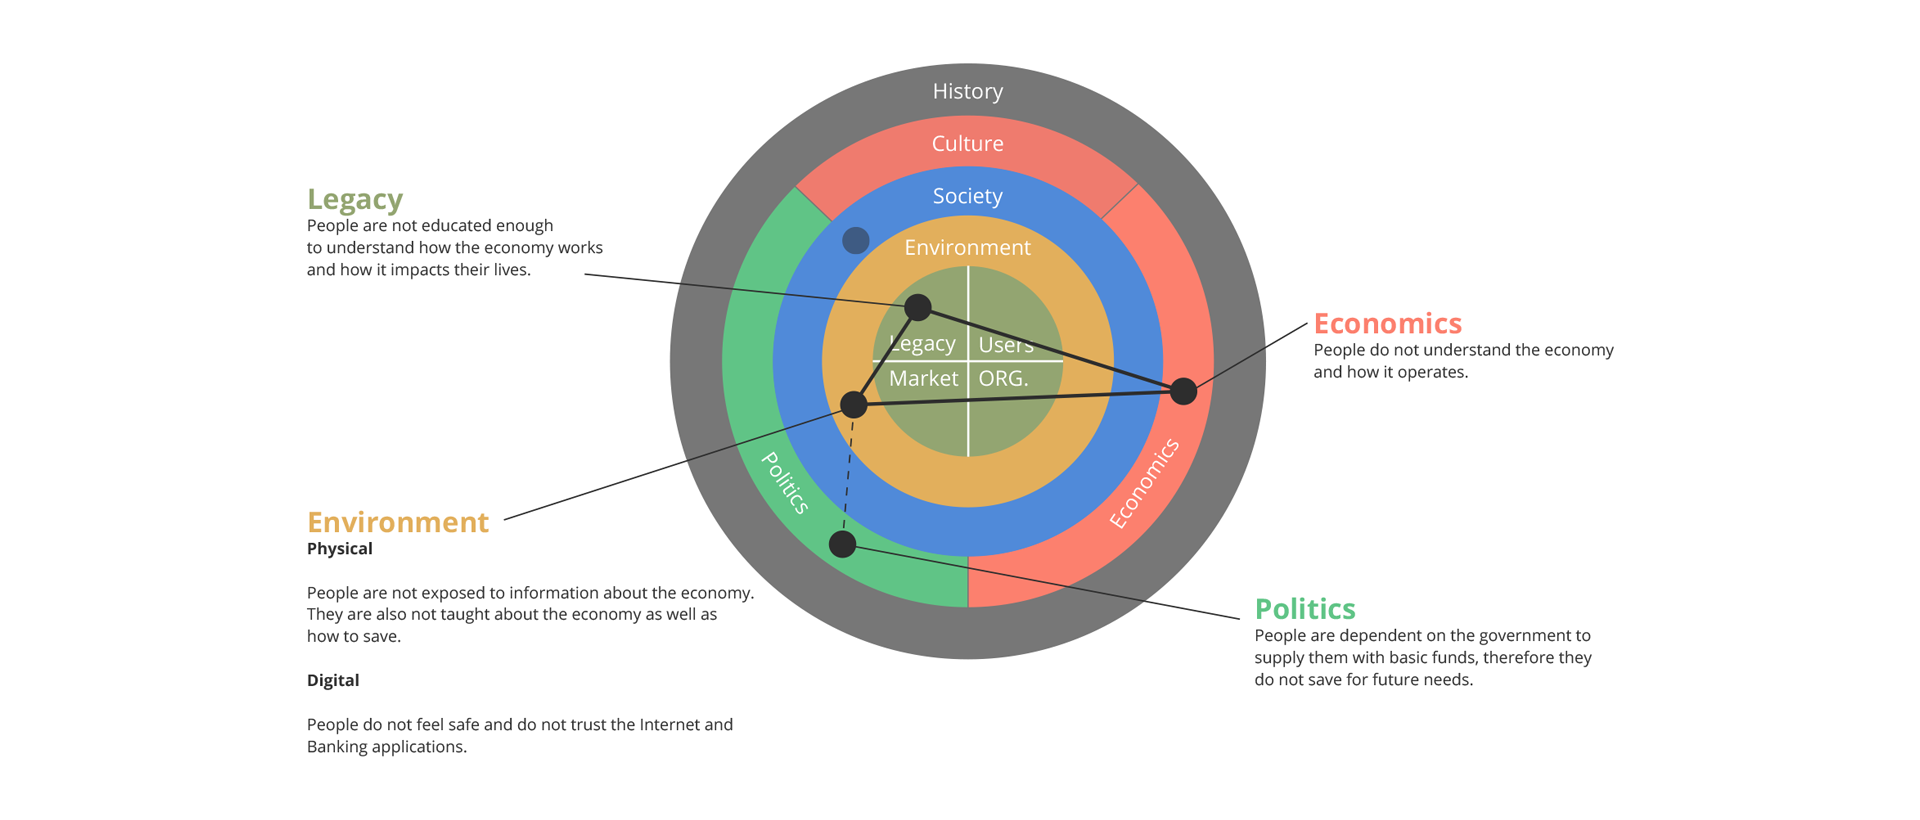
Firma Model - Phase 1 (Insights)
Firma Model - Phase 2 (Insights)
Firma Model - Phase 3 (Insights)
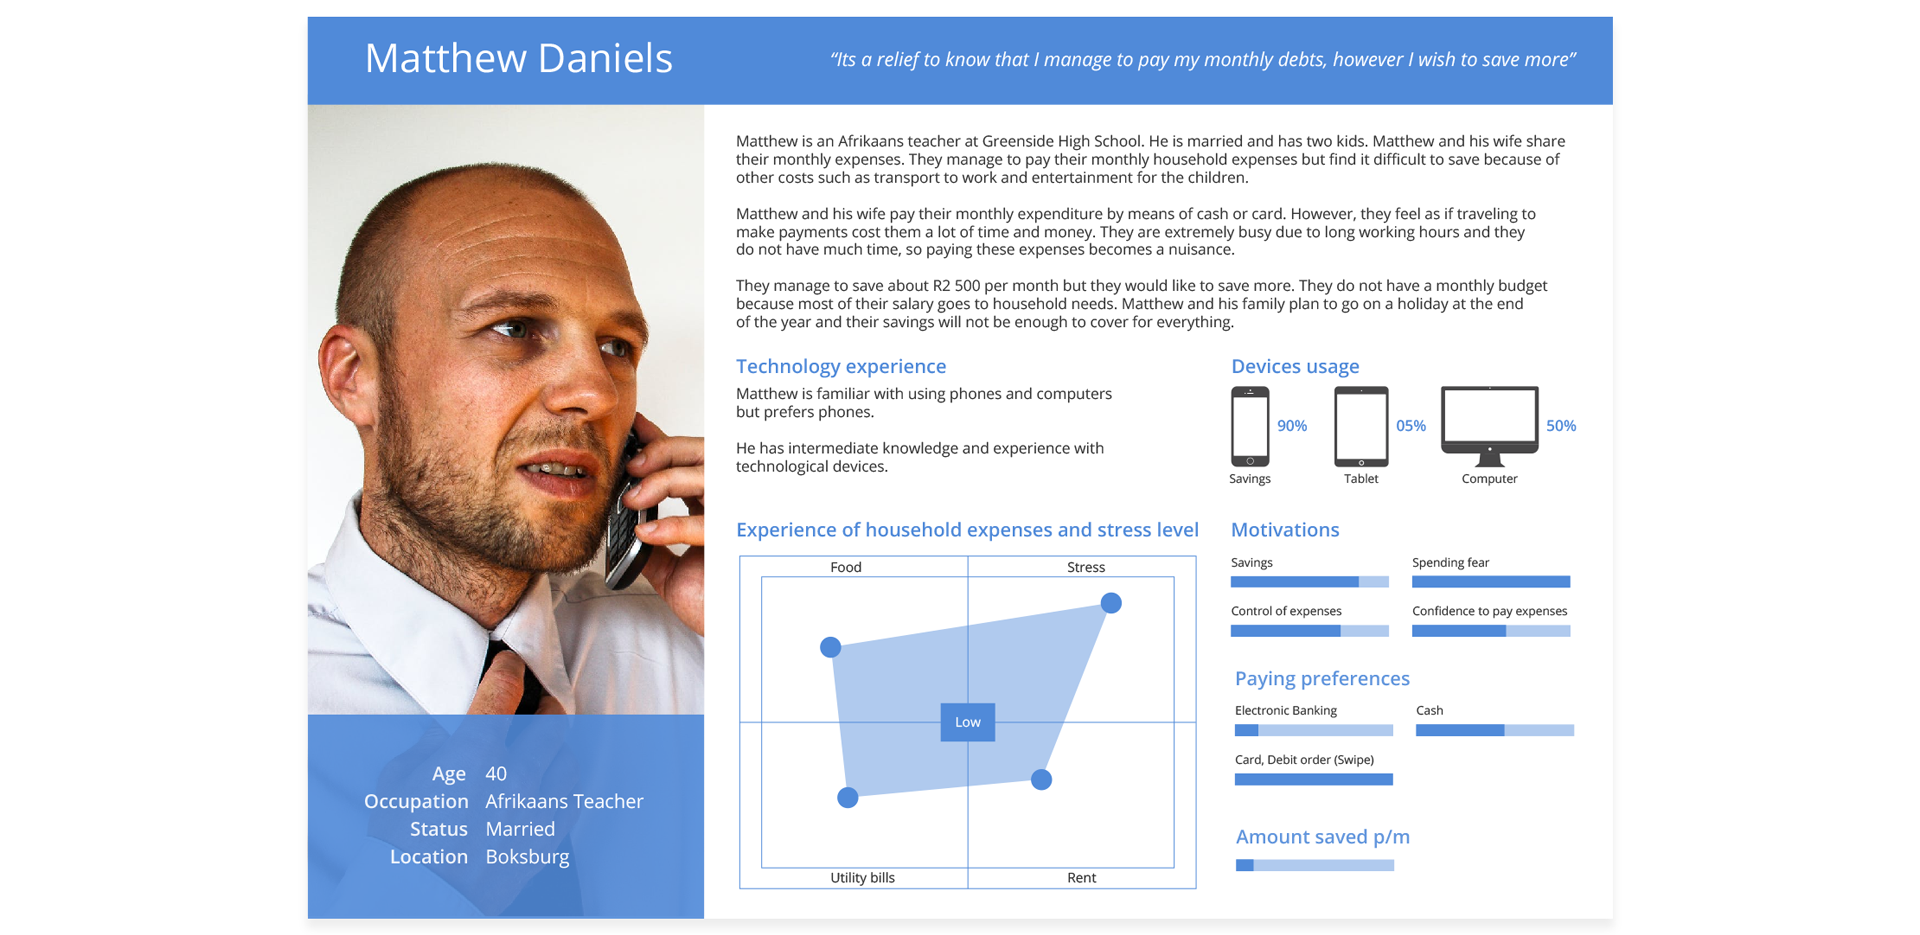
Personas
Synthesis
The persona model is composed of three most common household expenses, which are food, utility bills and rent. These expenses are basic necessities and have caused high stress levels due to cost rates. Therefore, the last section of the model is focused on stress so that we are able to measure amount of stress caused by having to pay expenses.
The personas account for three types of social classes. These classes are high class, middle class and low class. This enabled us to understand and identify people from different financial situations and backgrounds. This has also aided us in creating a solution that all three users can benefit from.
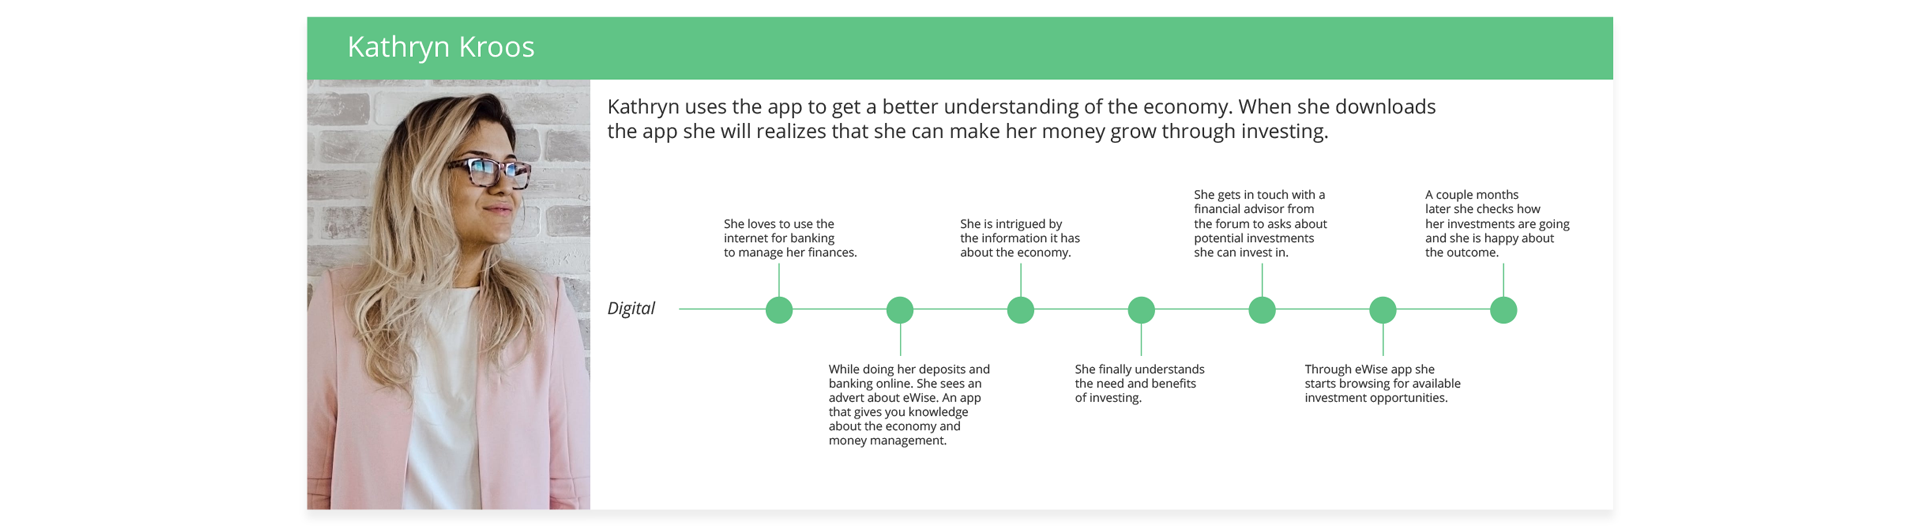
Persona 1 (Higher)

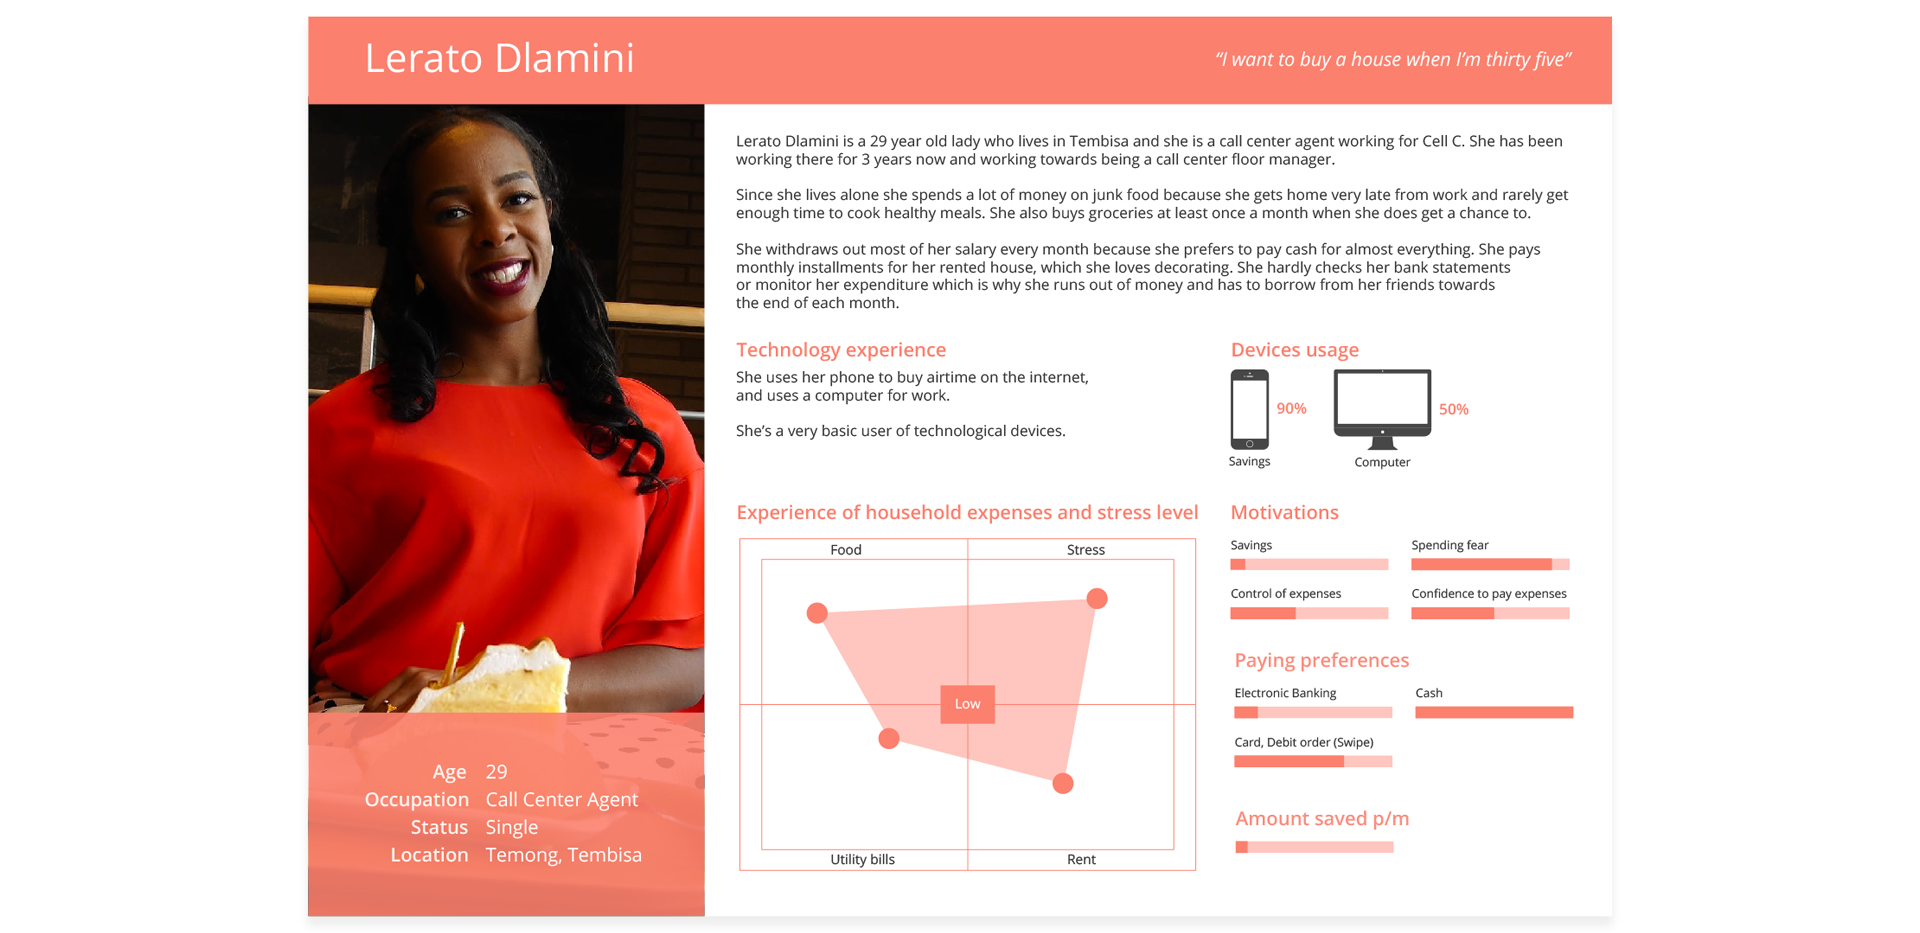
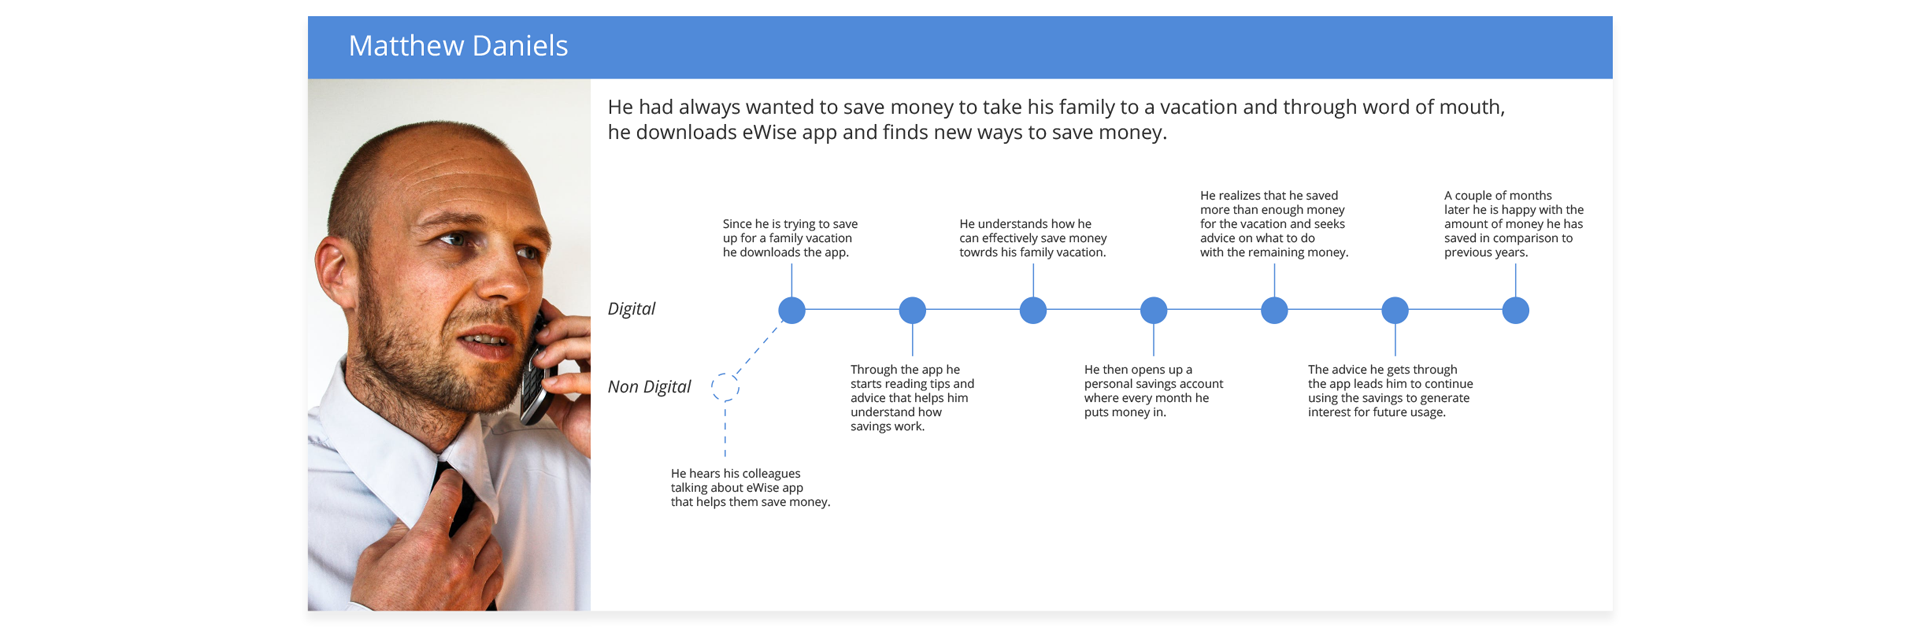
Persona 2 (Middle)
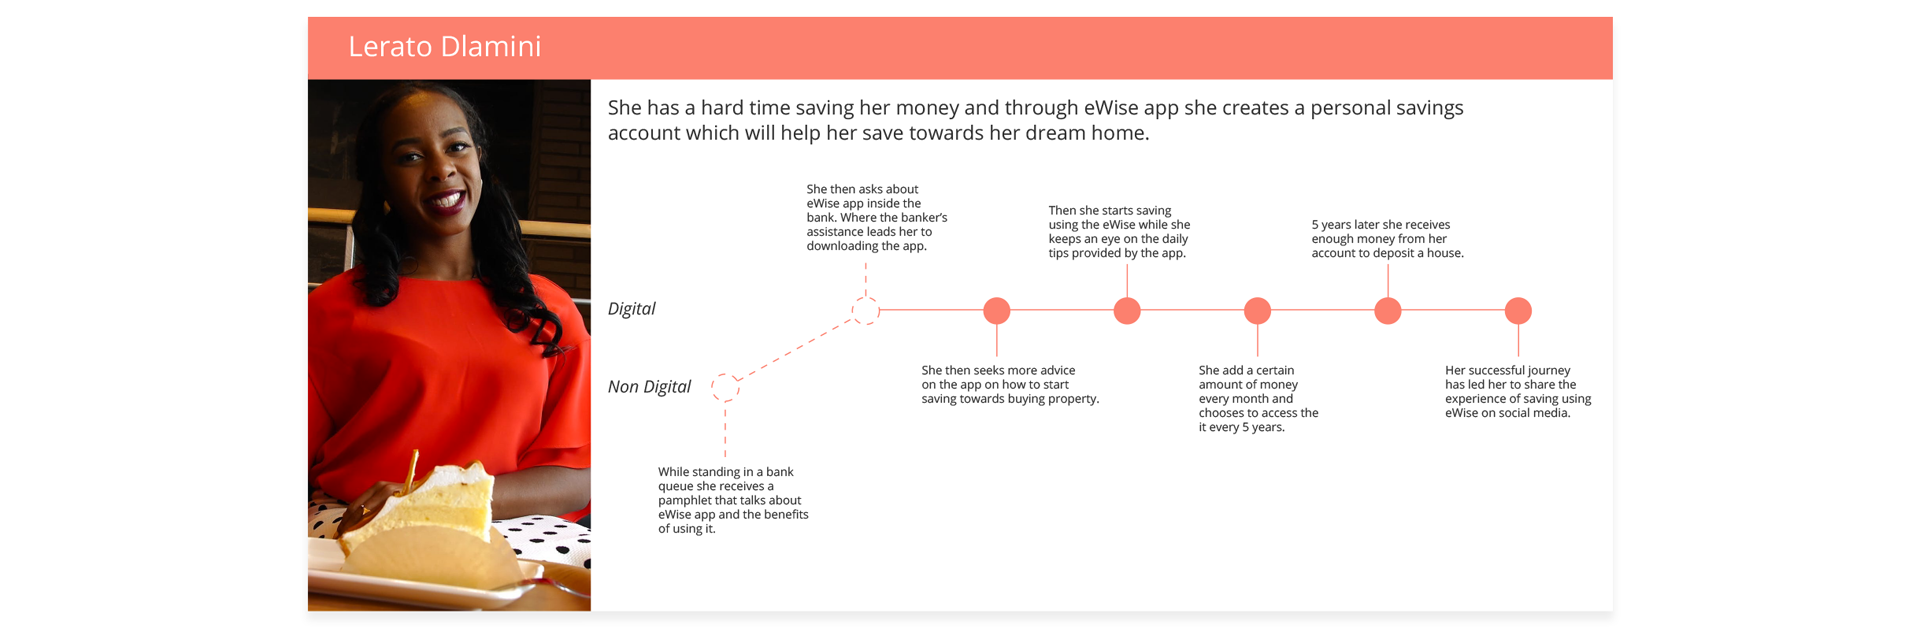
Persona 3 (Lower)
Solution / Concept
Strategy
Our solution is to educate people about the importance of saving money, investing by means of an application using various sorts of interactive methods such as forums and financial advisers.
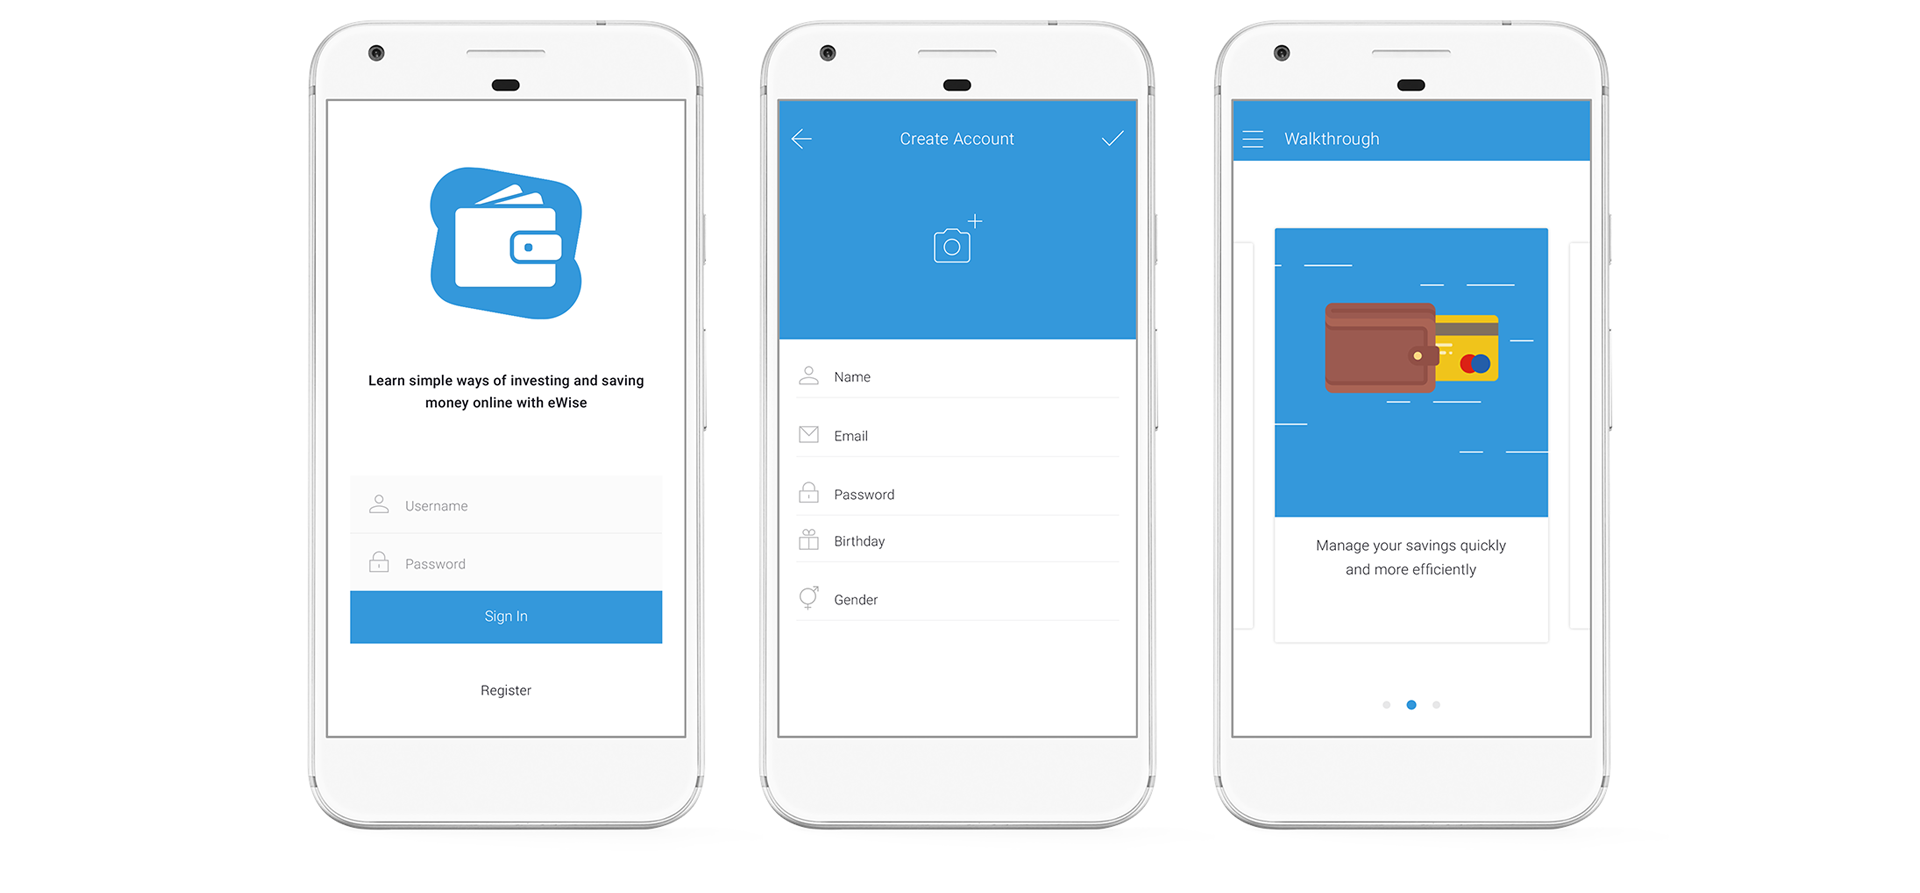
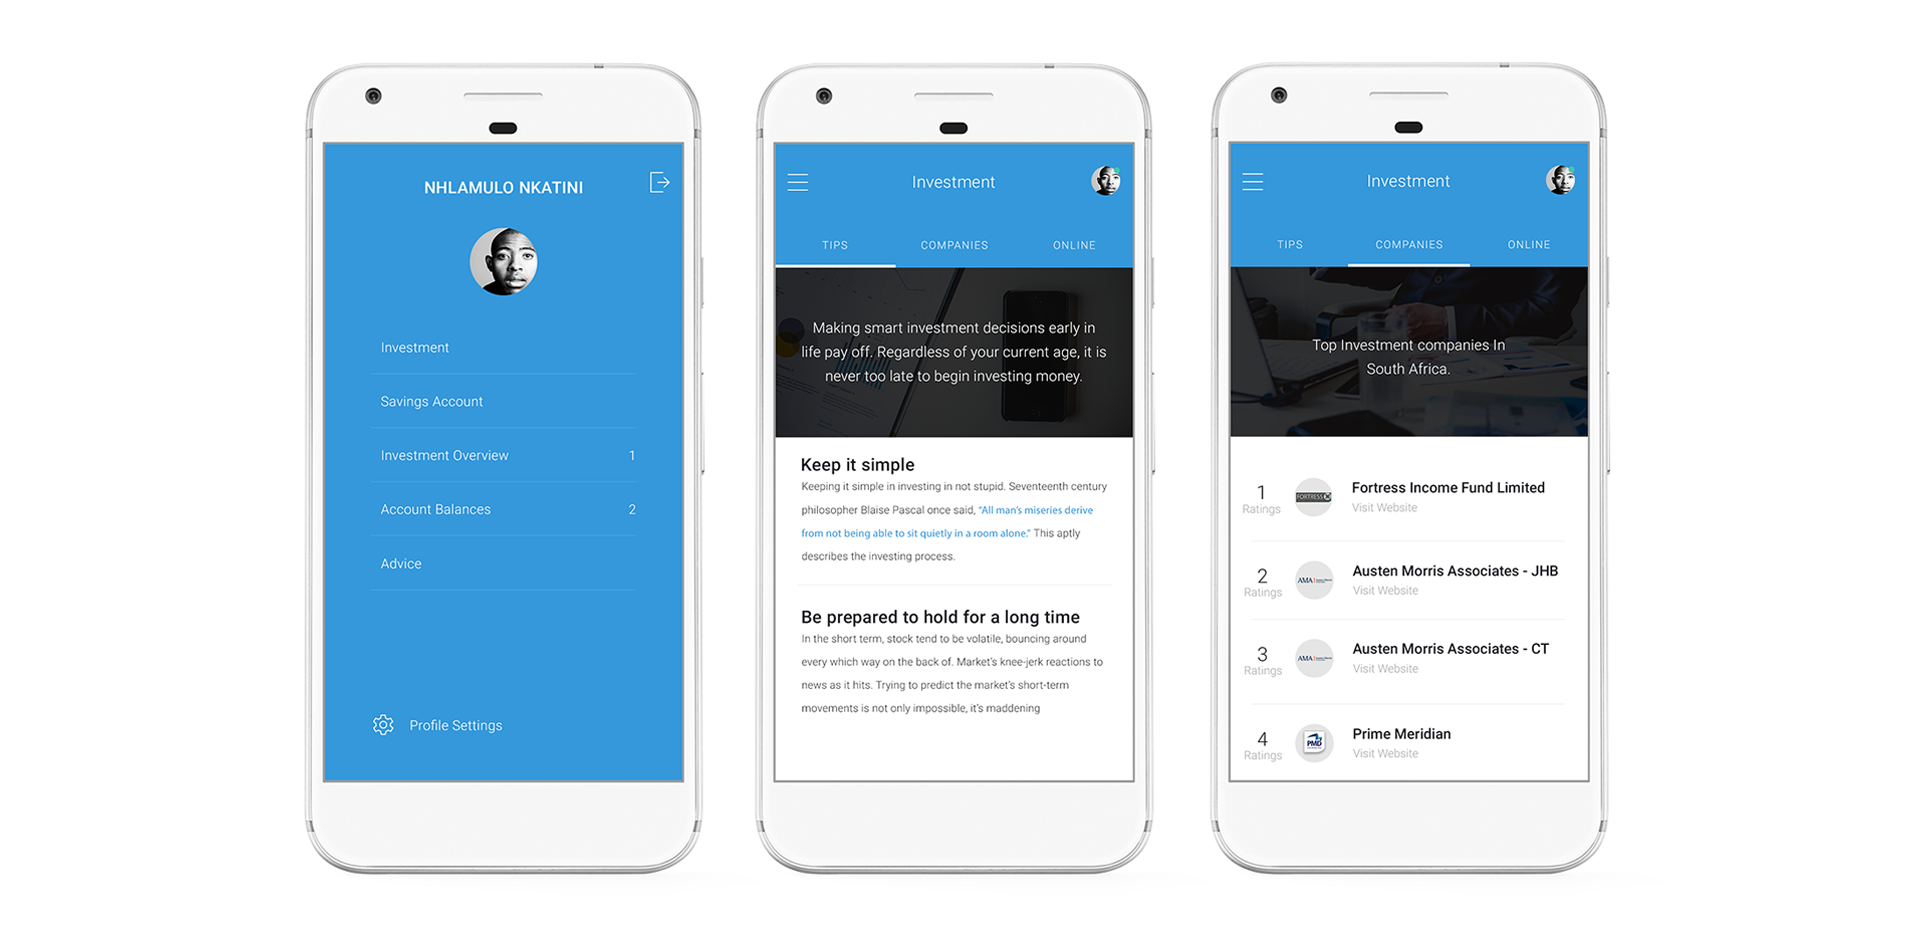
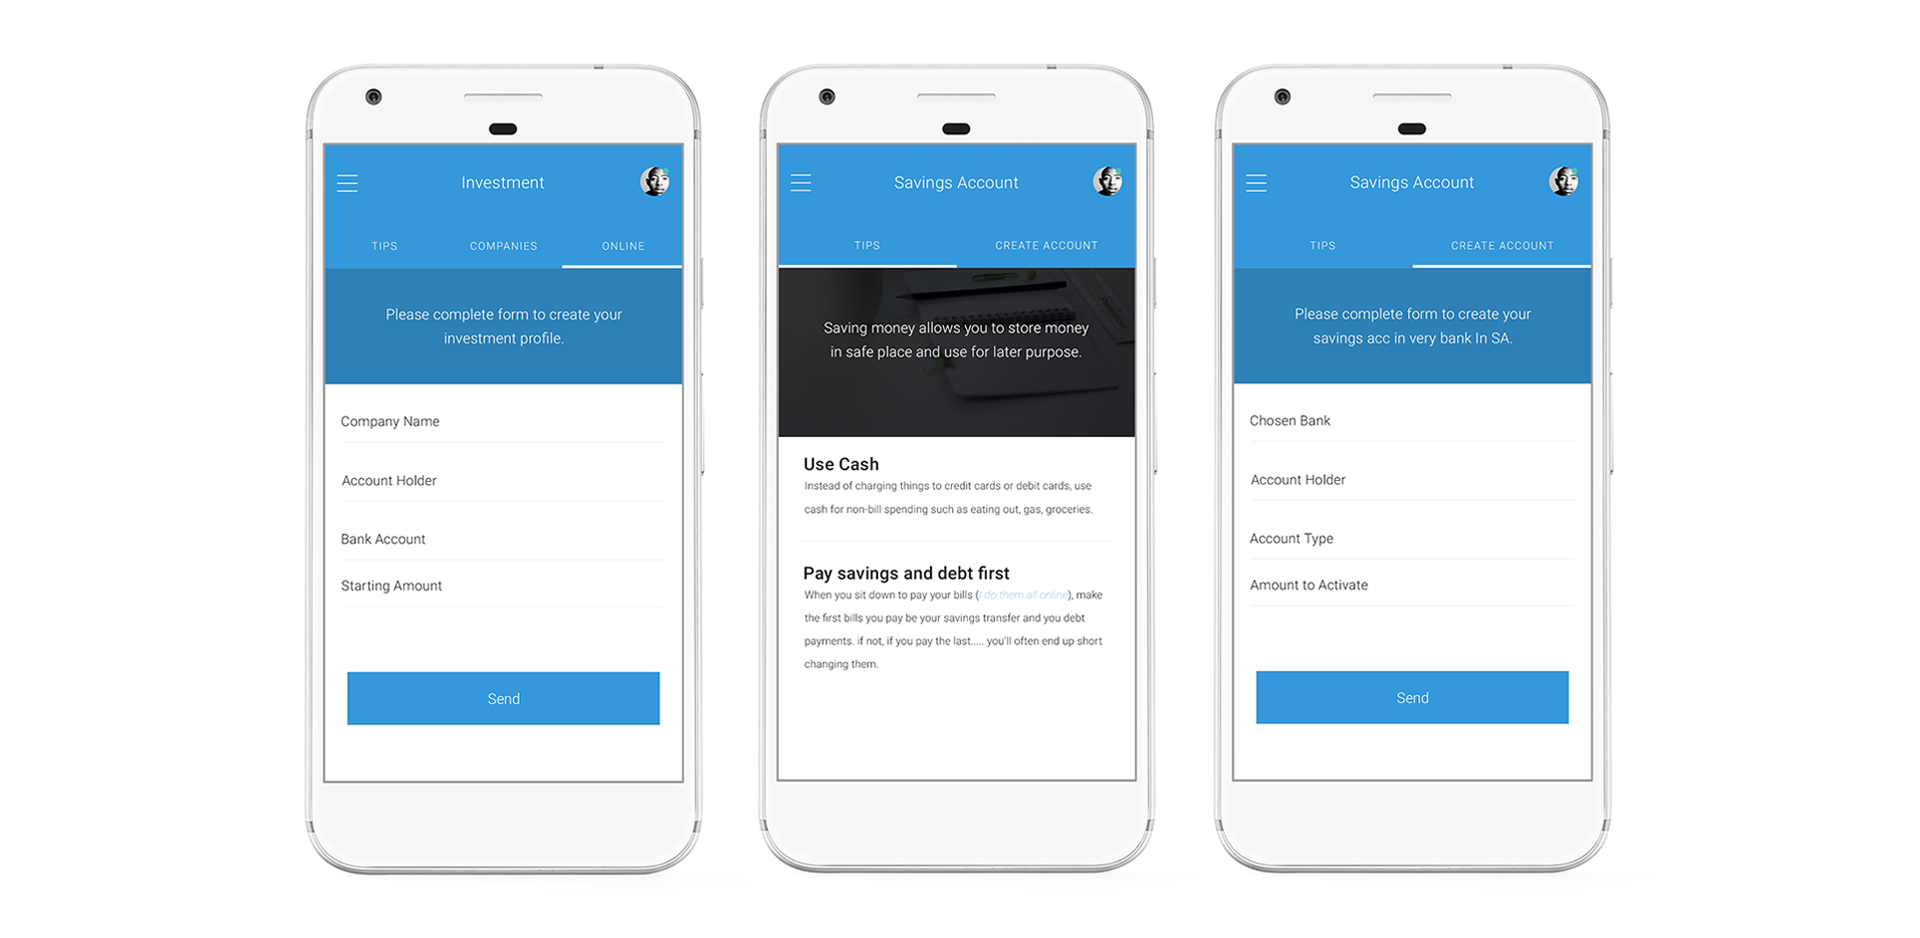
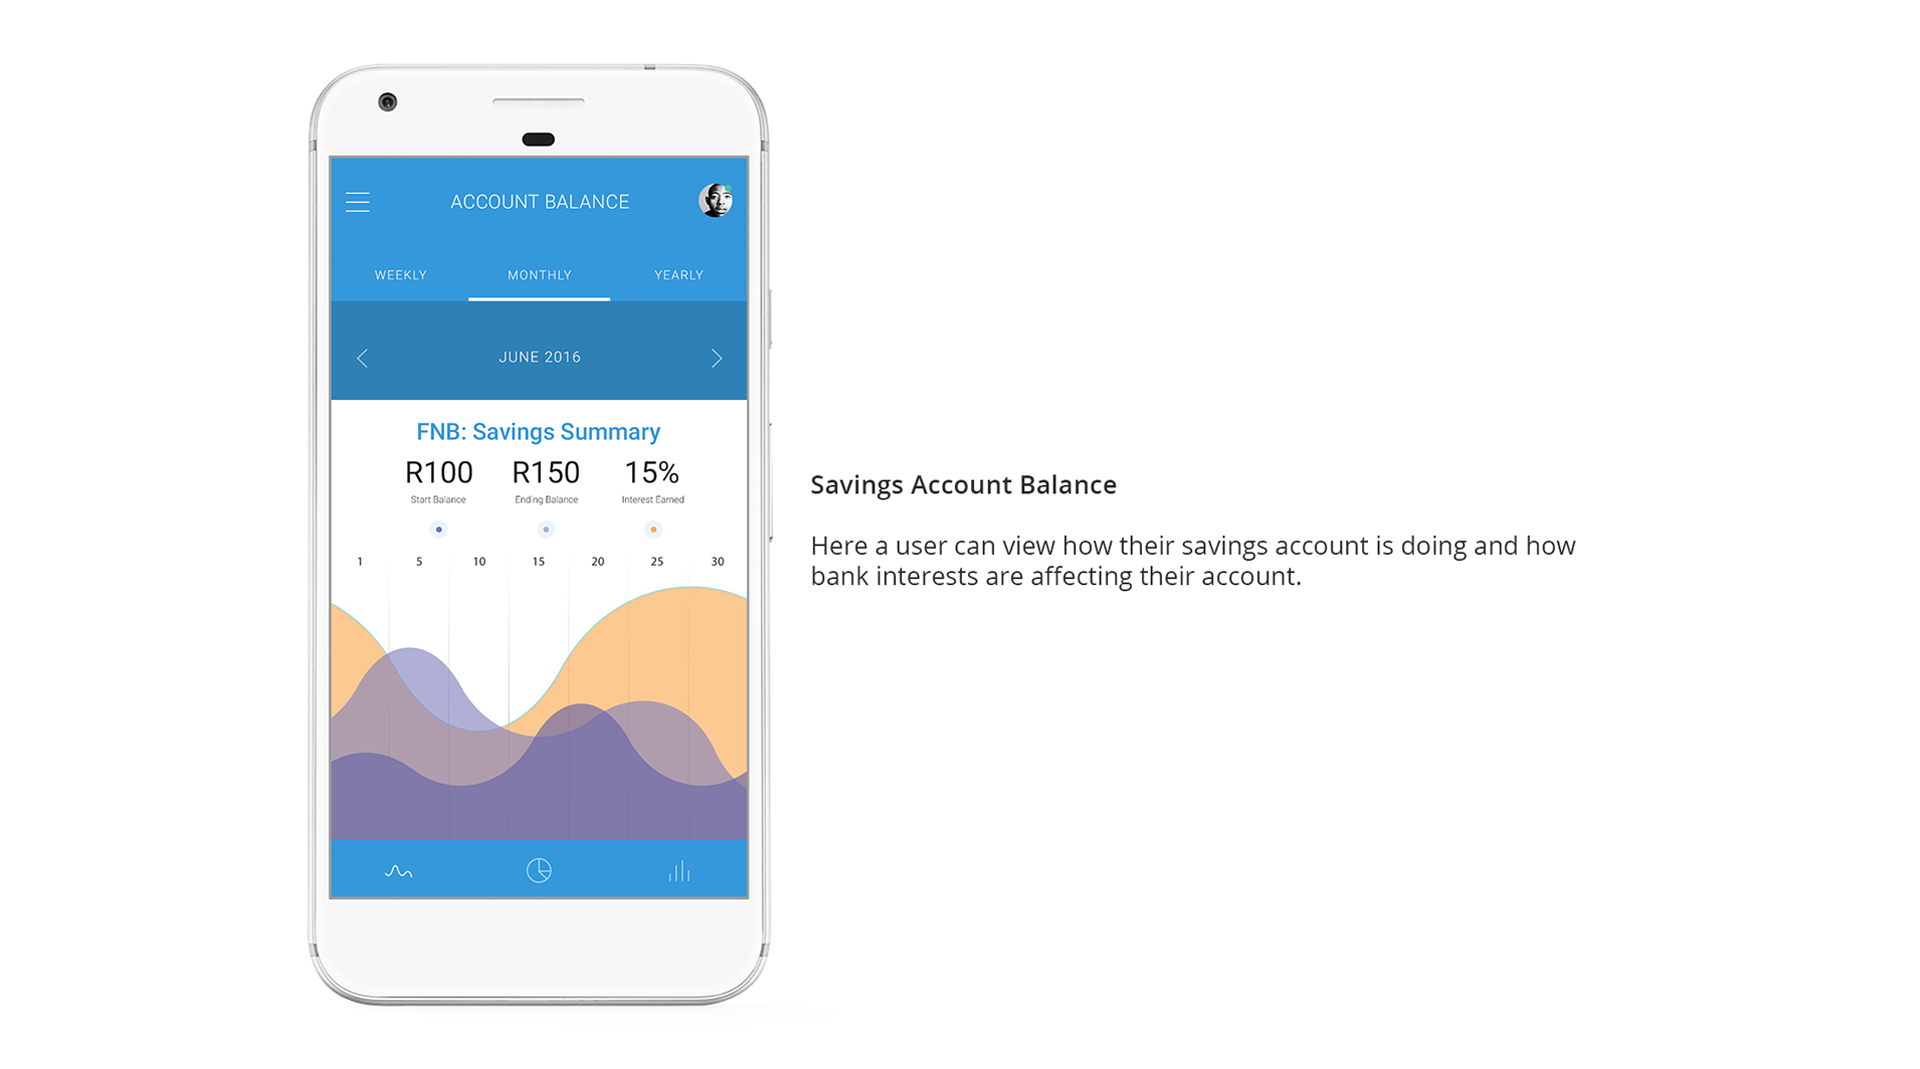
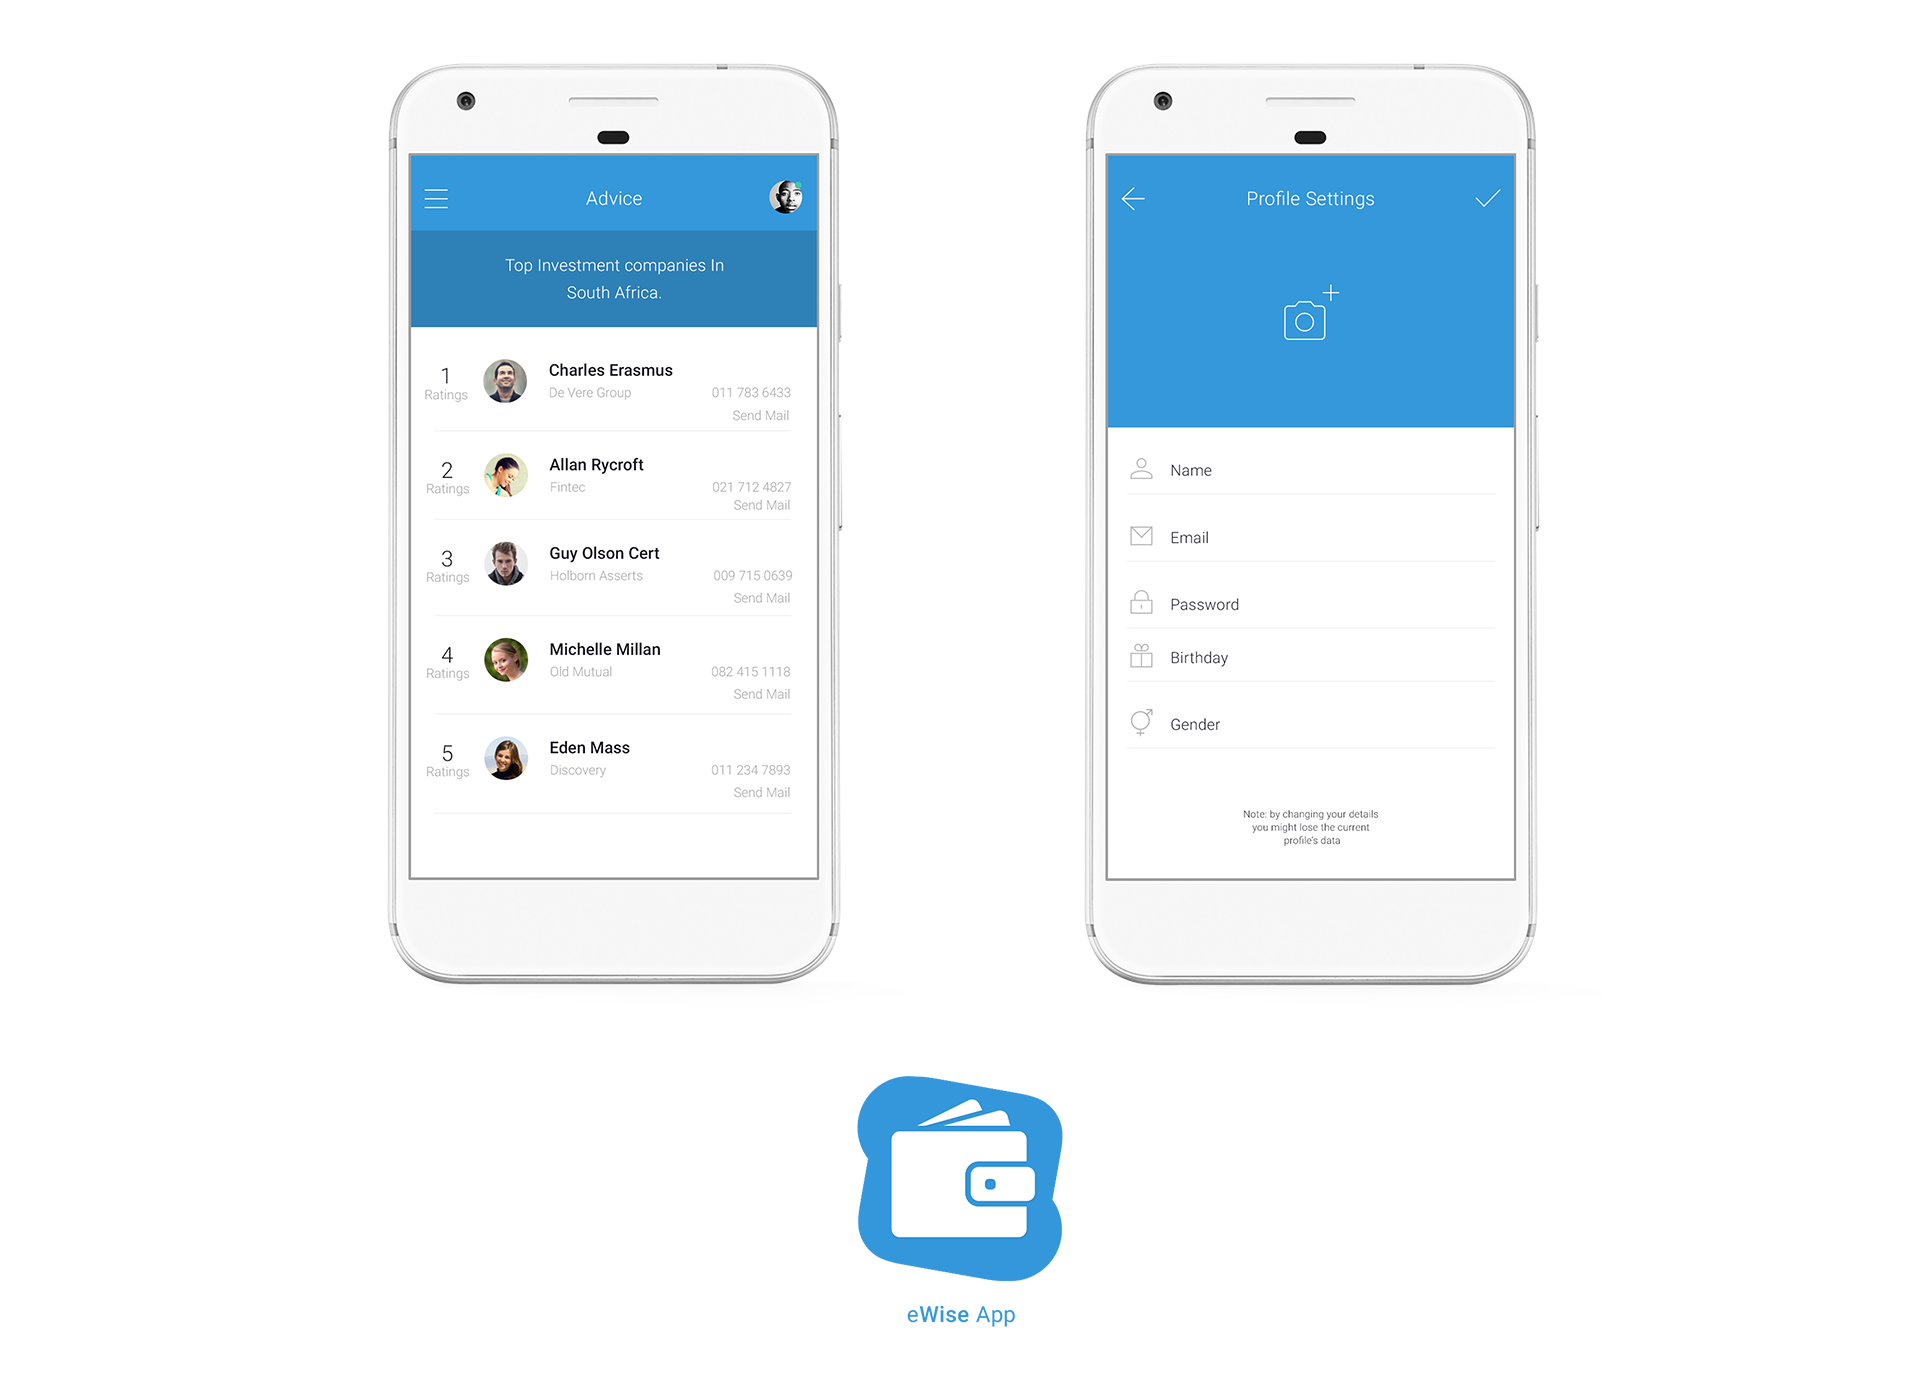
What was created (eWise App)
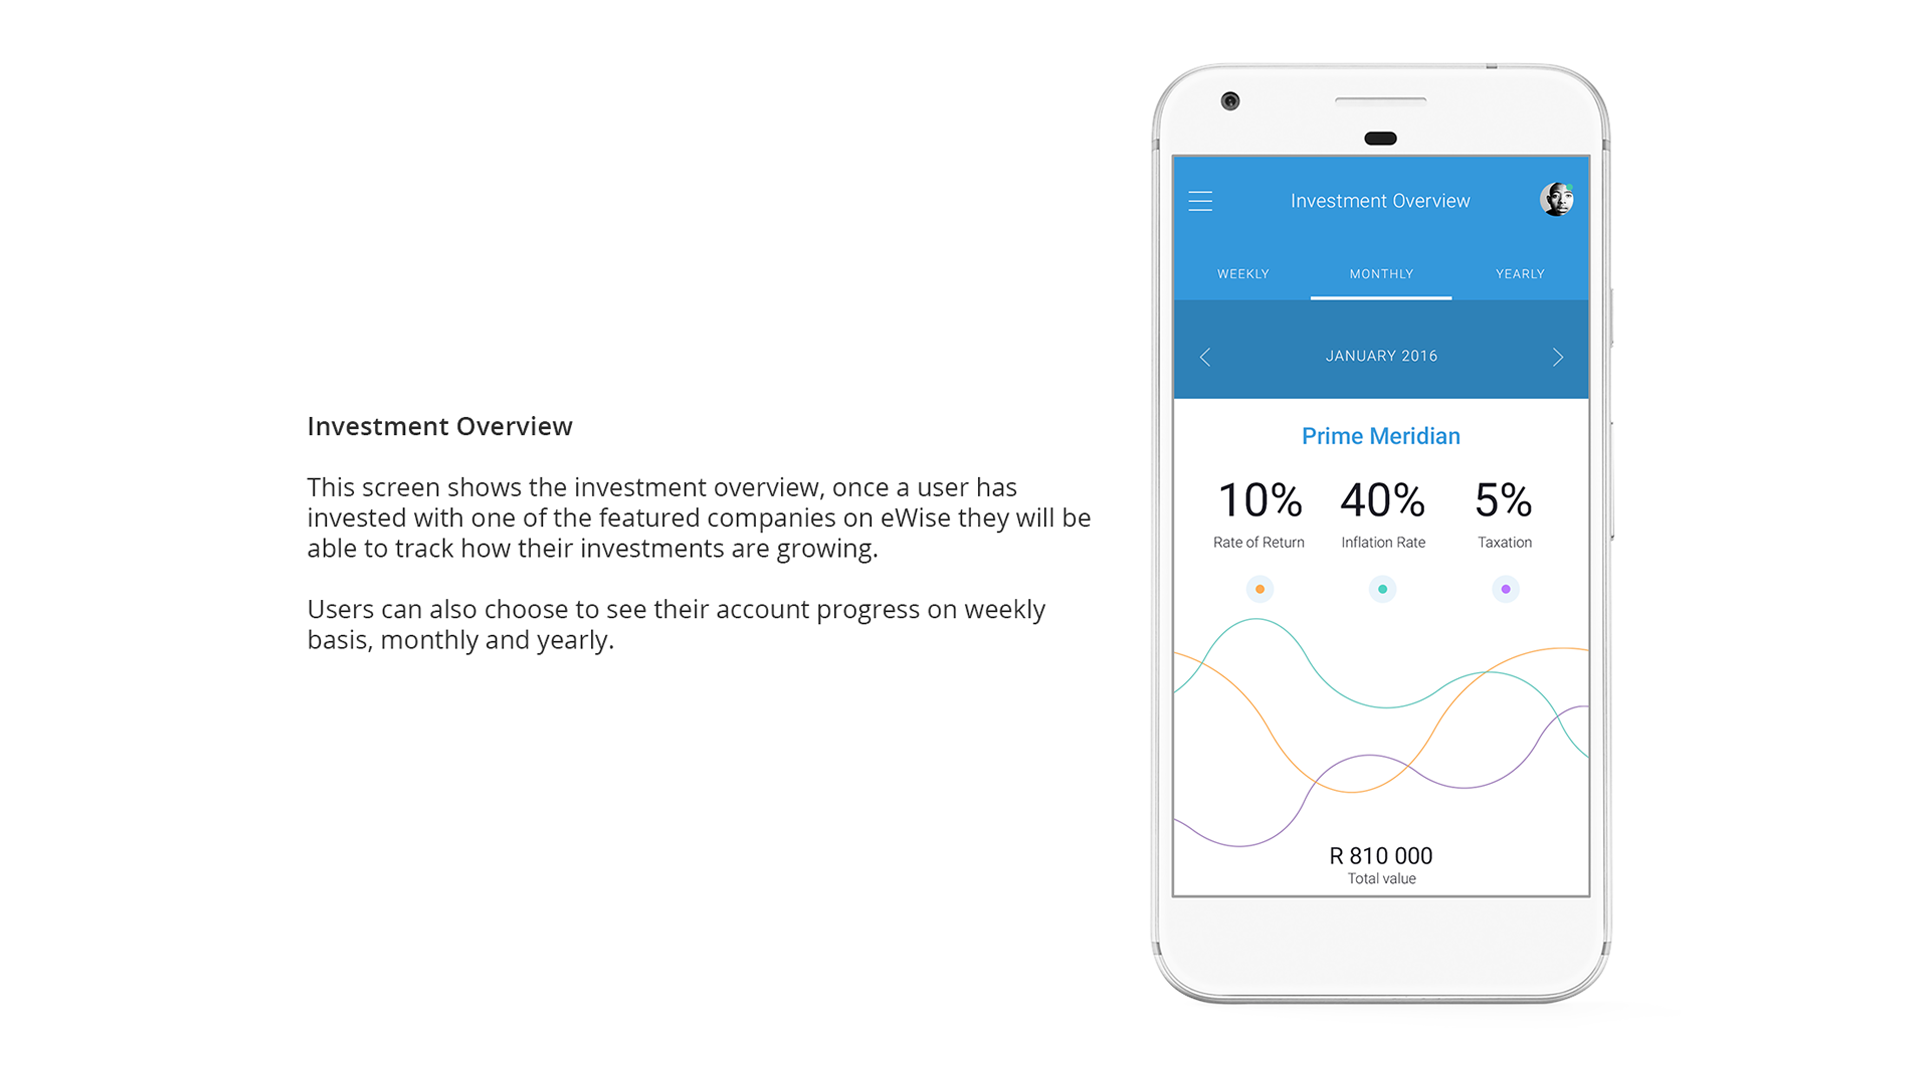
eWise mobile application helps provide guidance and tips related to online investments and financial savings. It also provides services of checking your investments growth, viewing your bank balances, getting the best financial tips and advisors in South Africa.
Customer Journey Mapping
Strategy
Customer Journey – 1 (Channels digital, Non-digital)
Customer Journey – 2 (Channels digital, Non-digital)
Customer Journey – 3 (Channels digital, Non-digital)
User Journey
Design
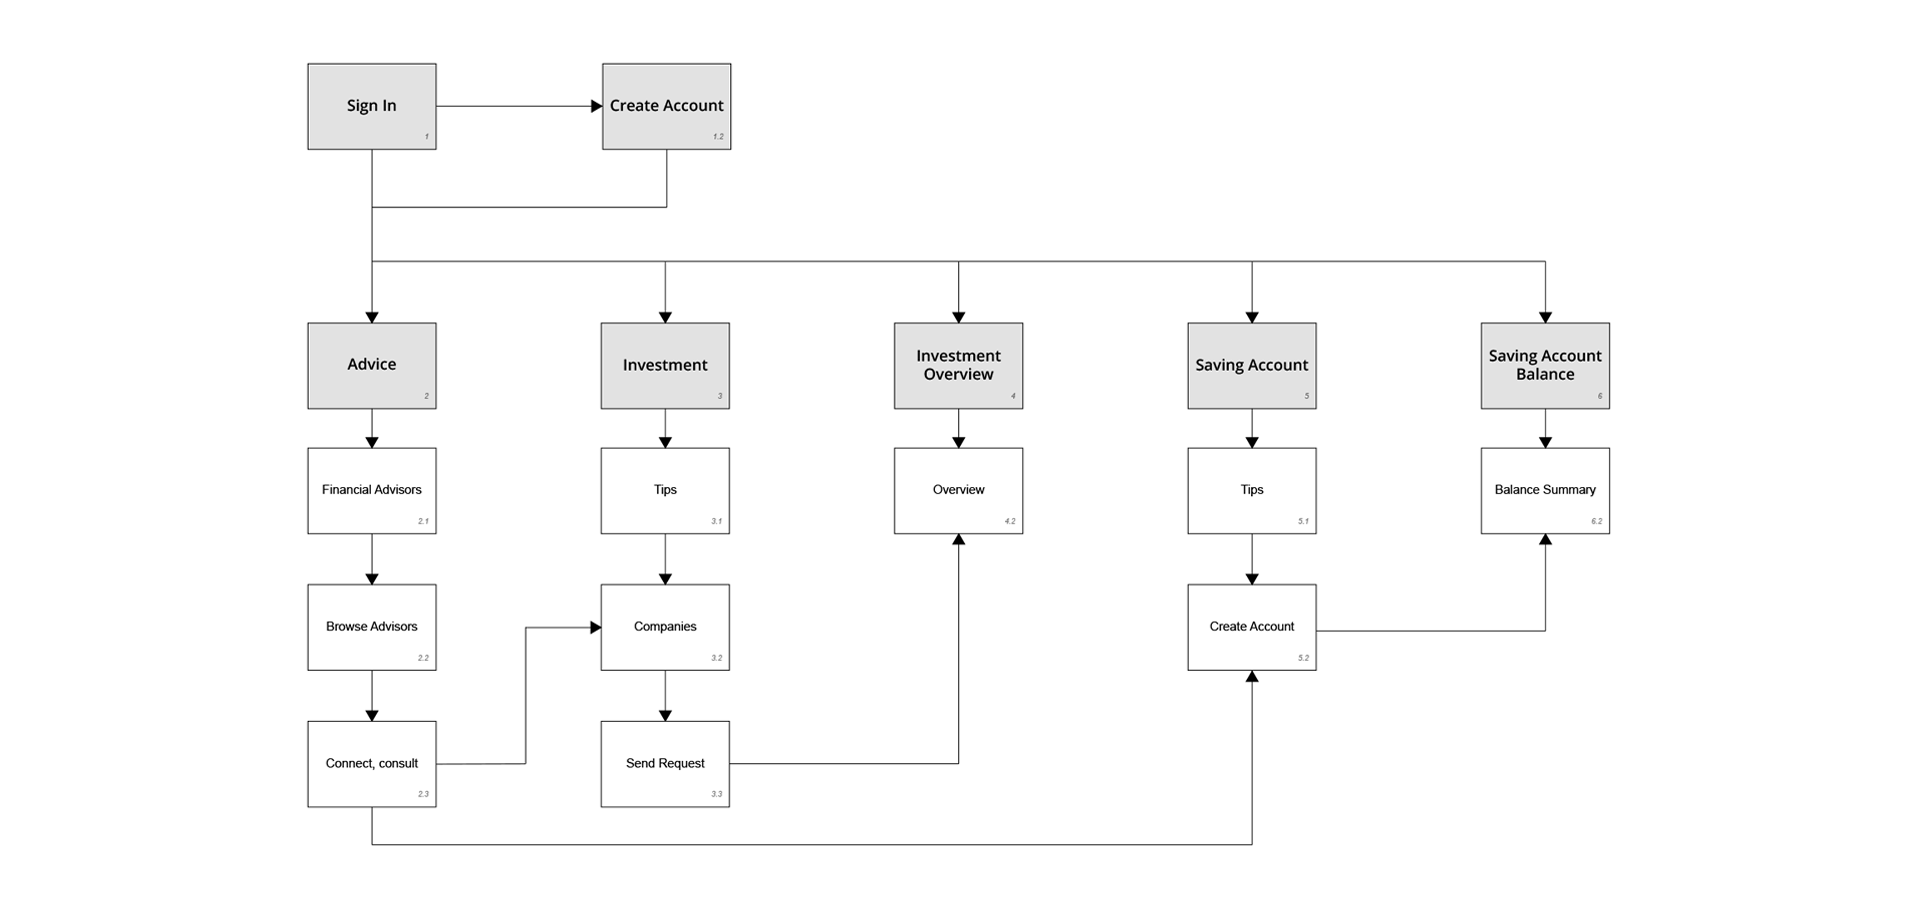
Site Map
Design
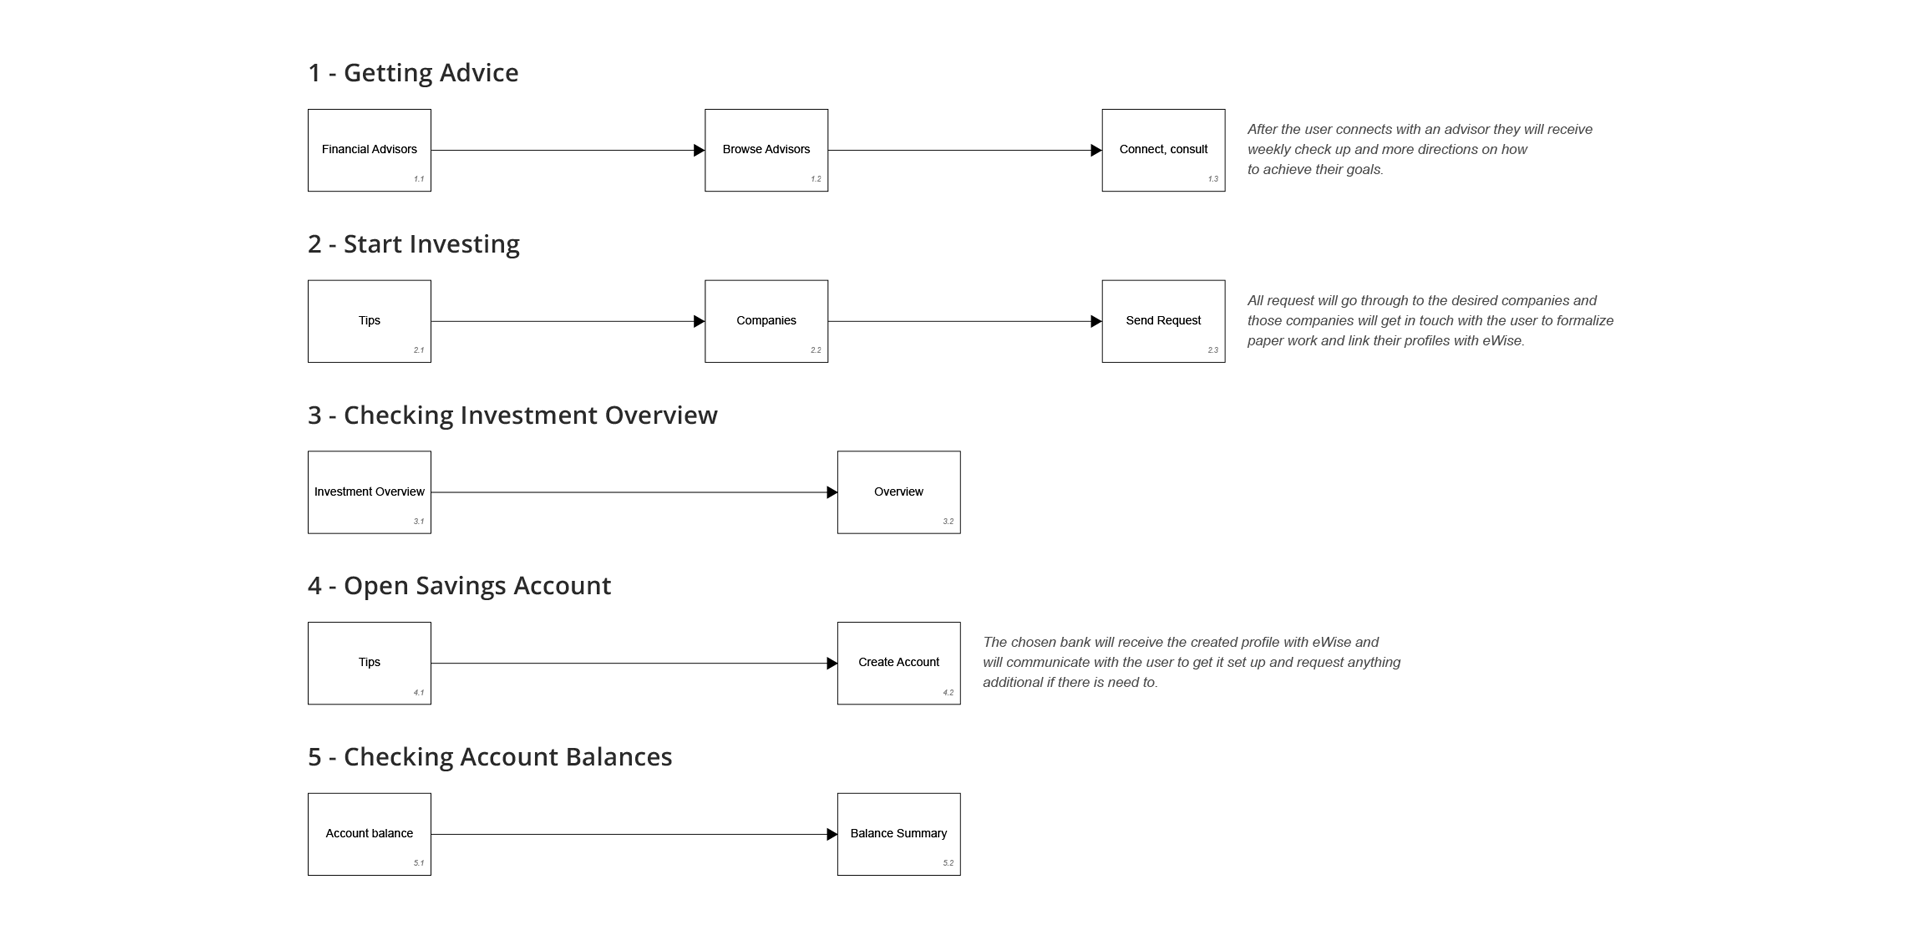
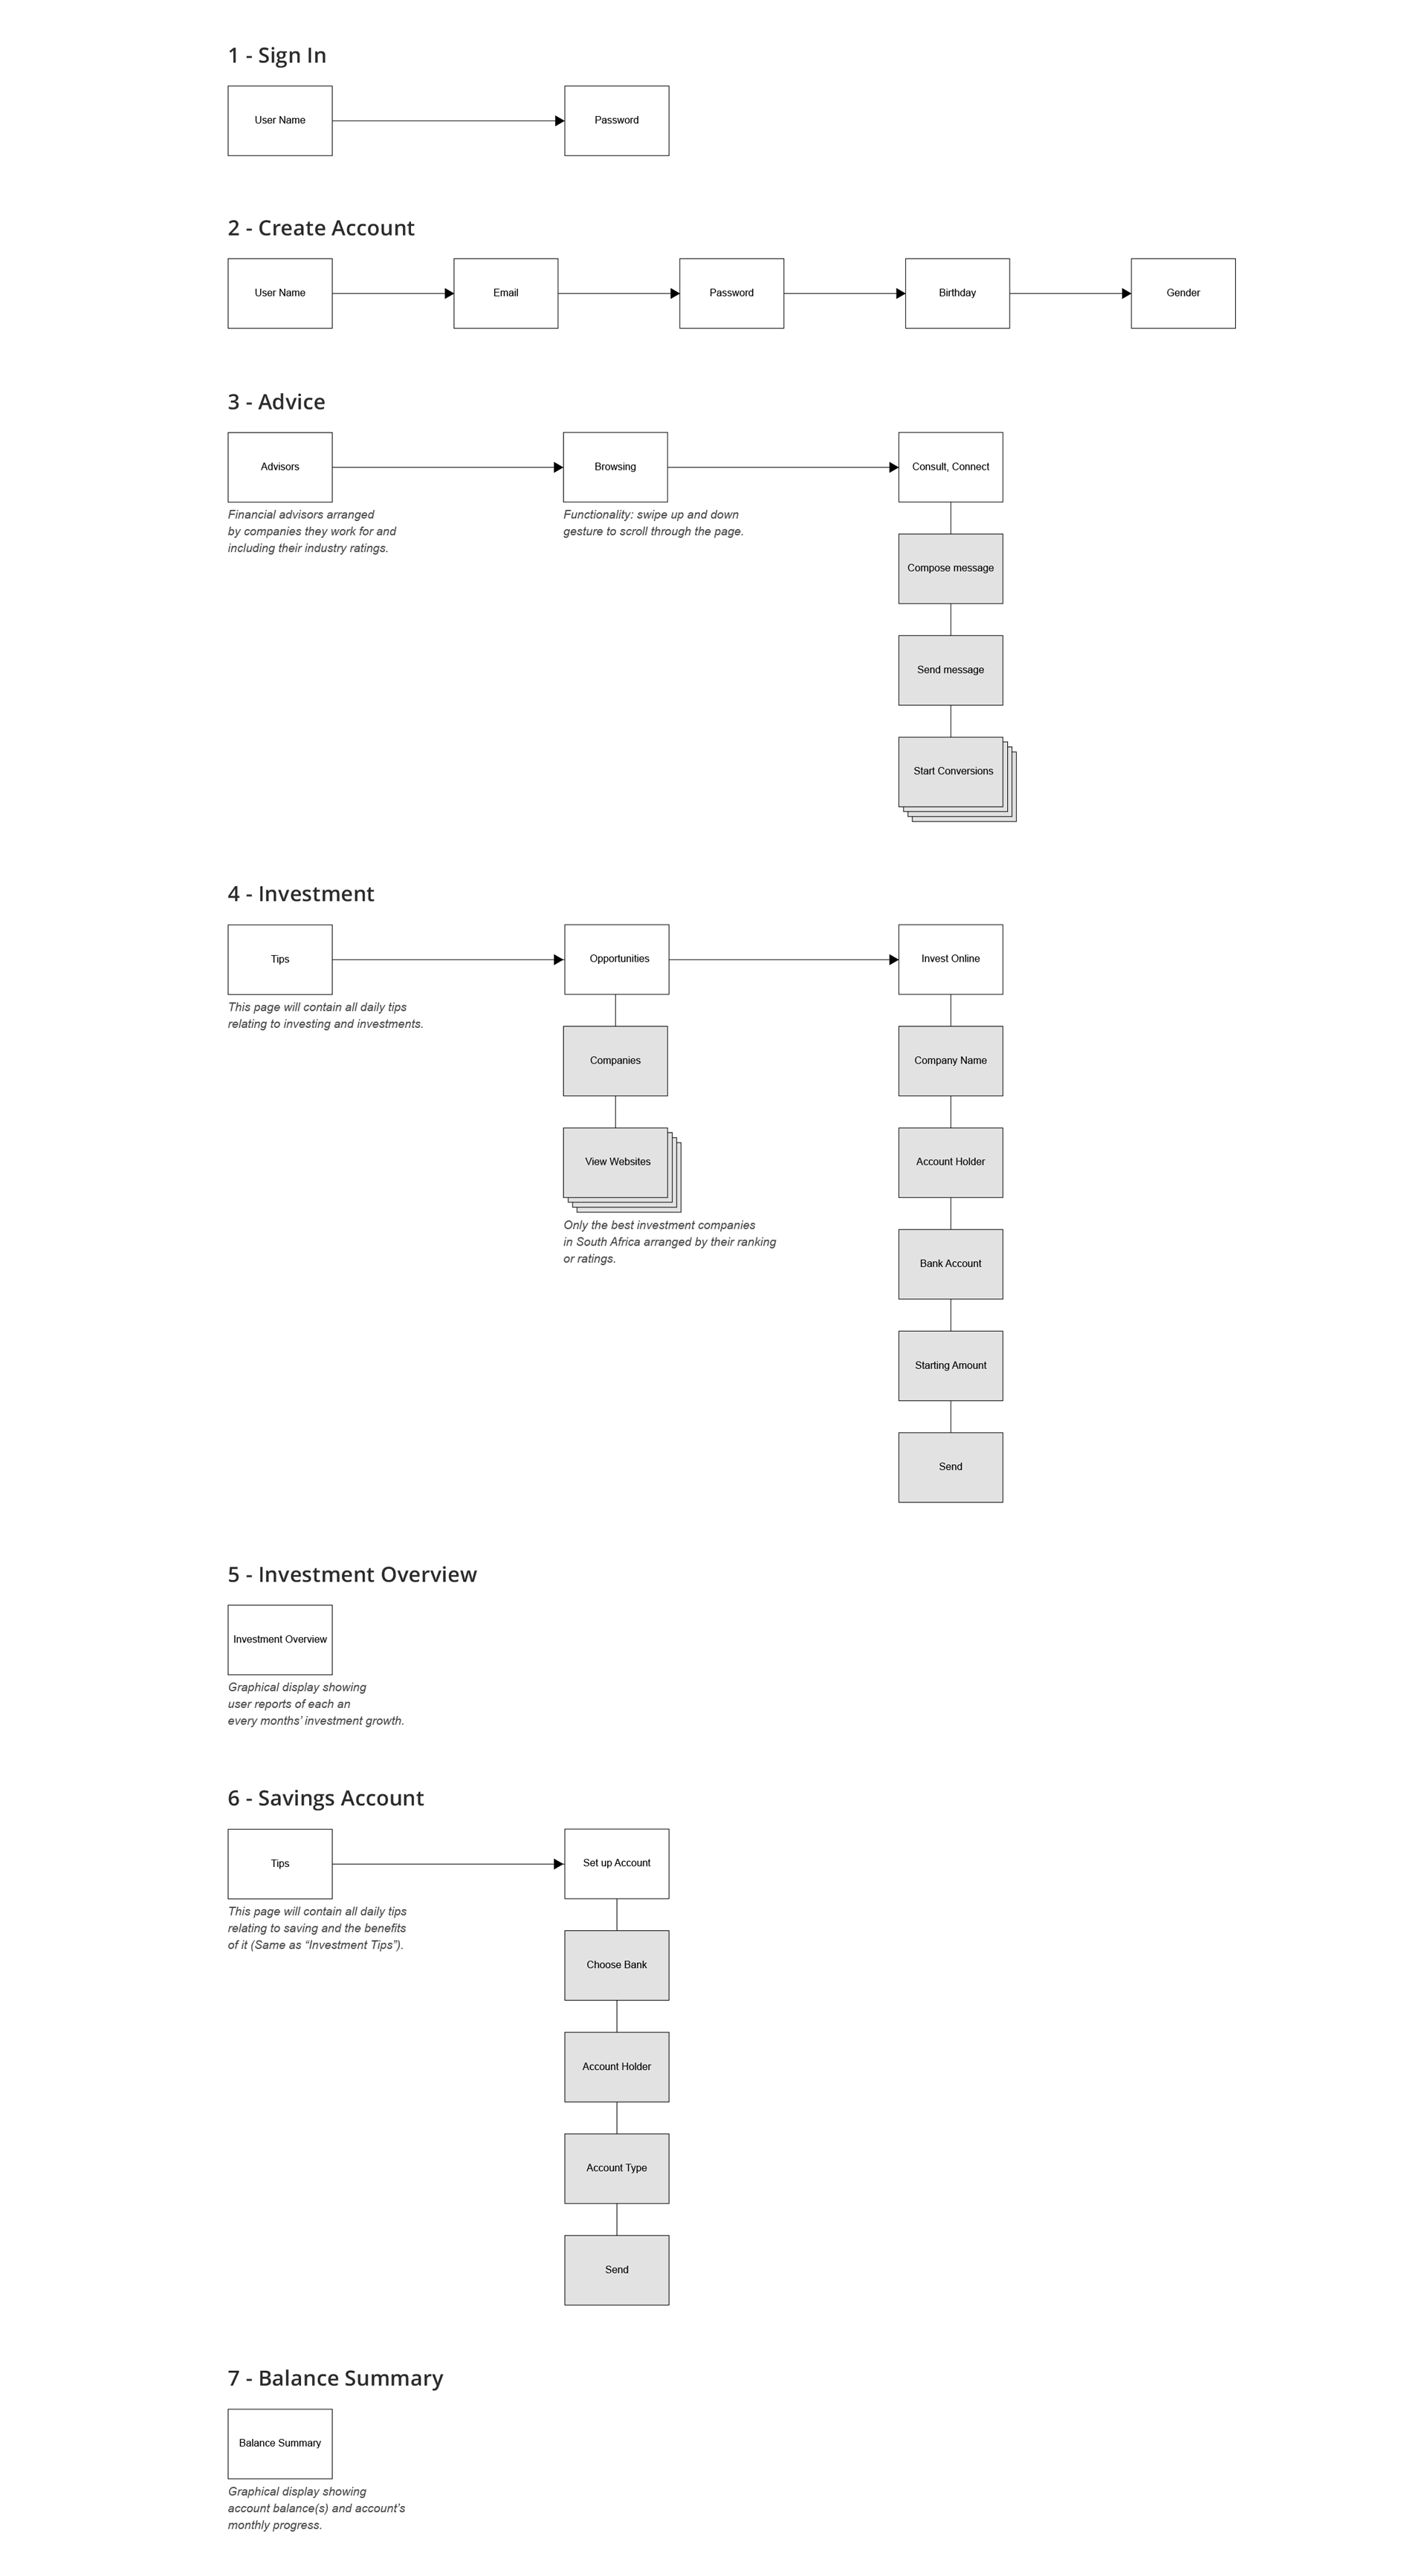
Task Flow Diagram
Design
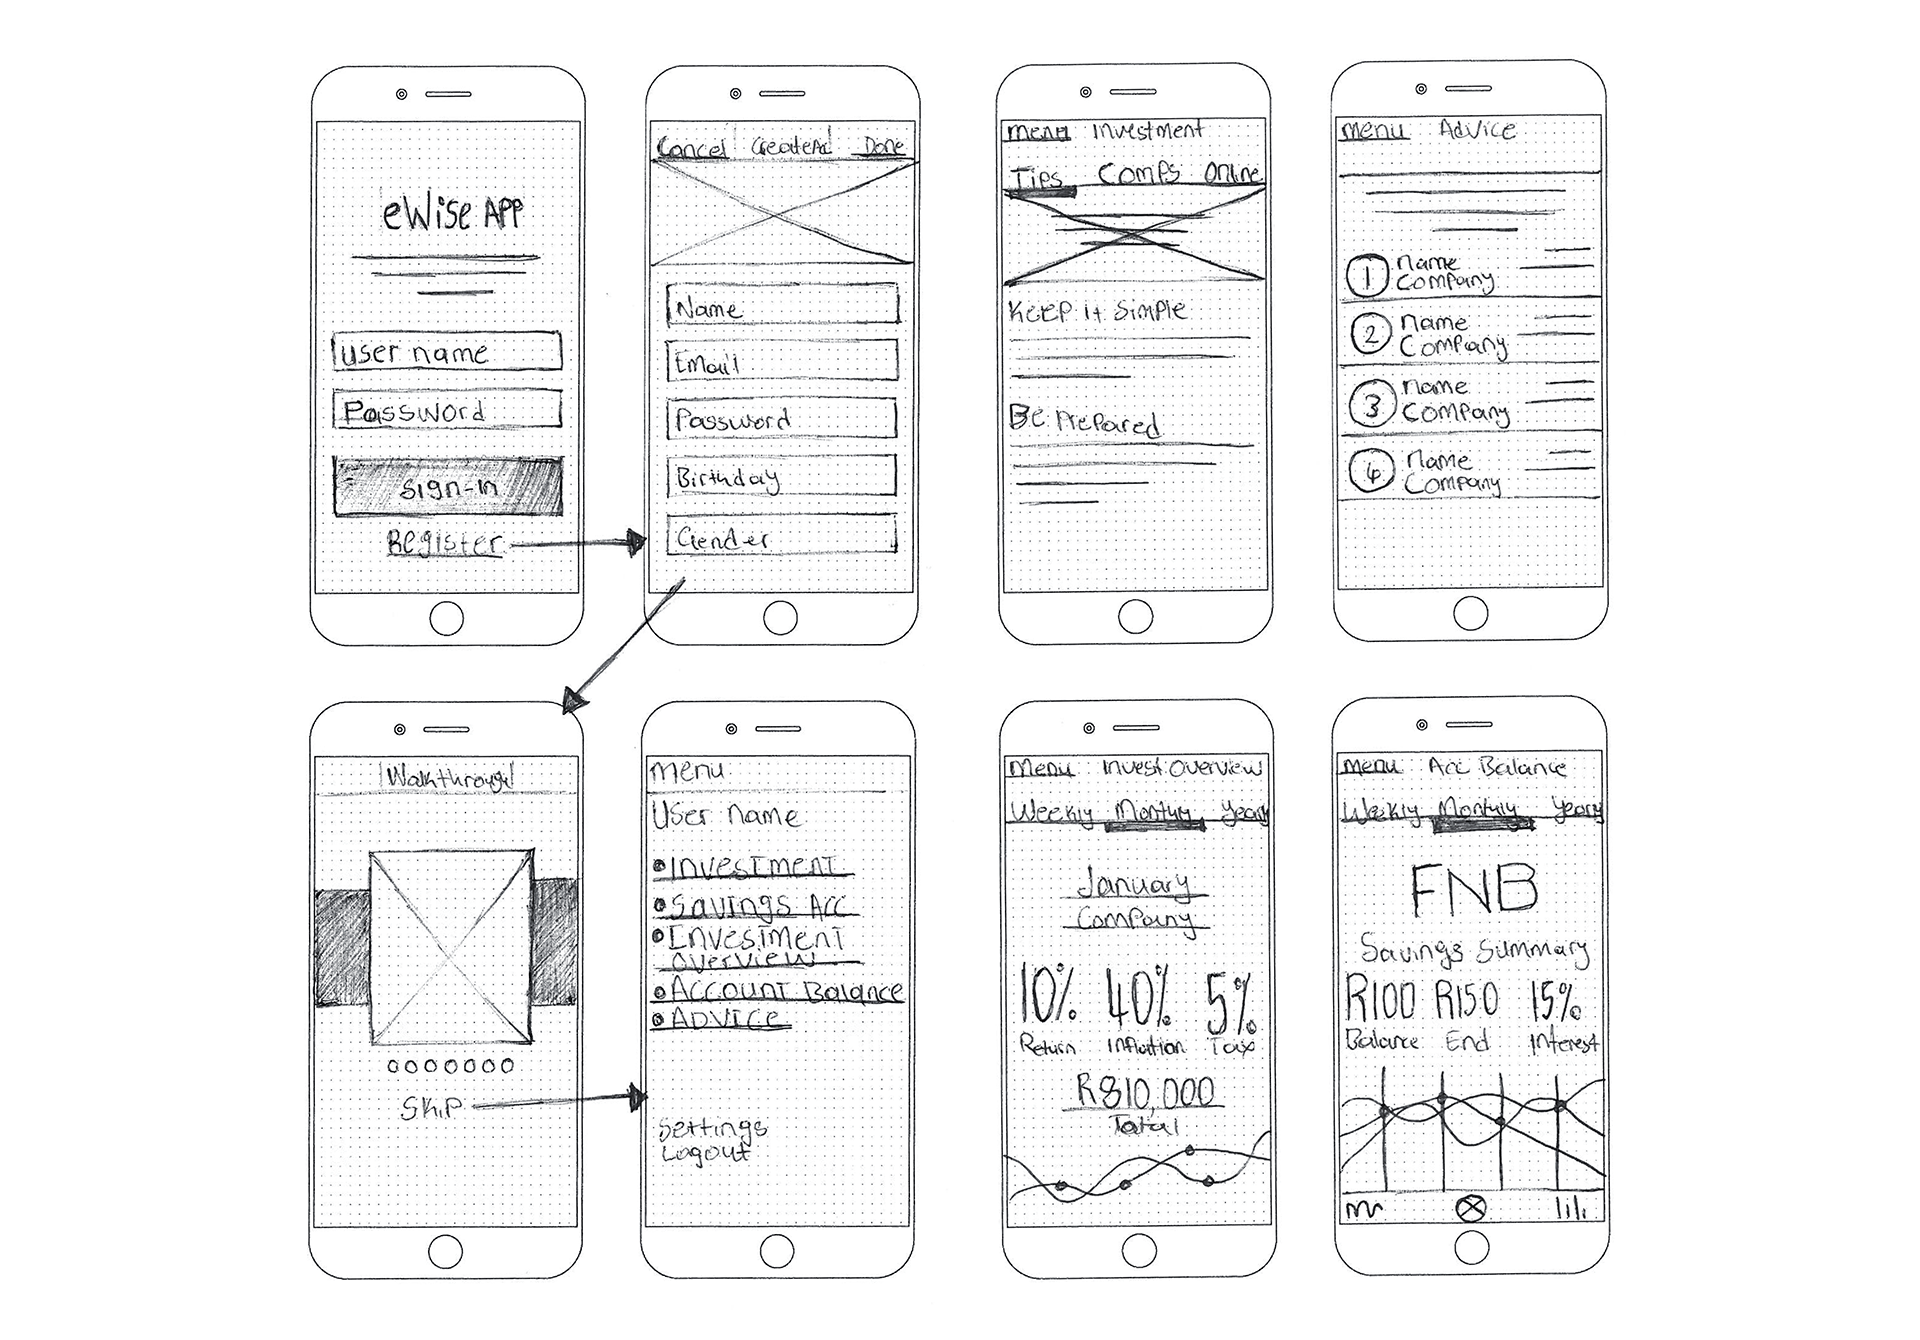
Sketches / Wireframes
Design
Paper Drawings
Digital Wireframes
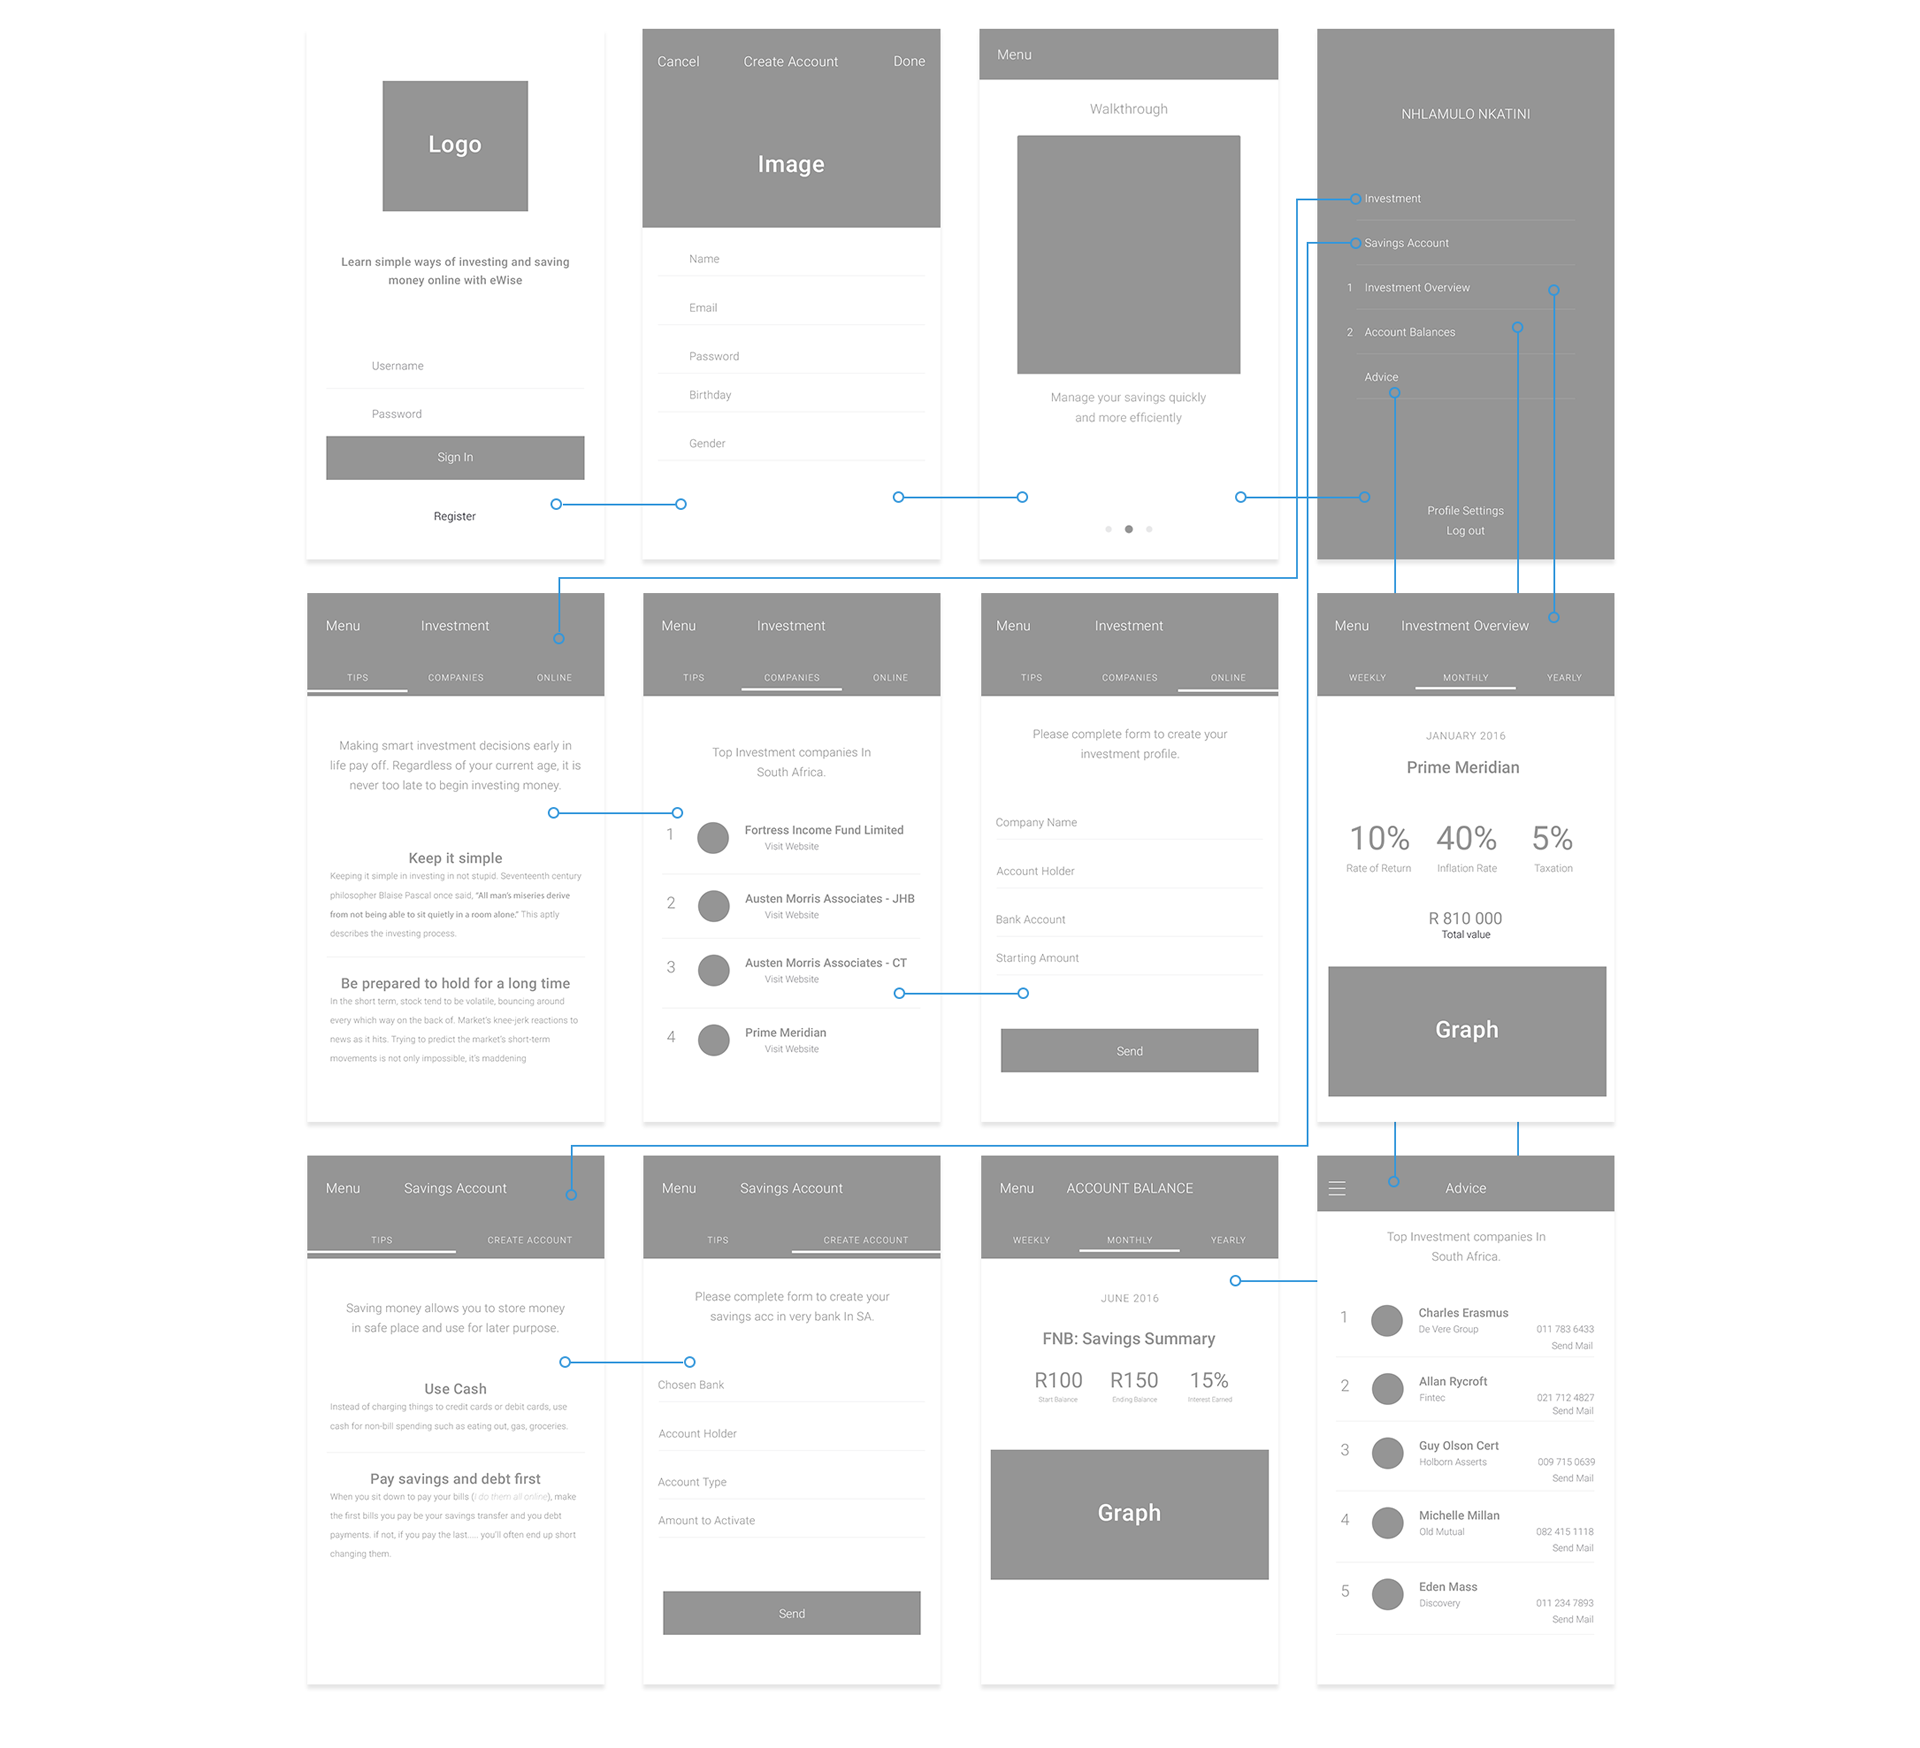
User Interface Design
Design
Also check out my Daily (UI) Projects